Ultimate Charts Spreadsheet Template Download
- Techriv
- May 13, 2024
- Entrepreneurship
- 0 Comments
Introduction
The Ultimate Charts Spreadsheet offers a comprehensive collection of spreadsheet templates designed to simplify the process of creating and utilizing charts in various applications. With two parts comprising different built-in types of charts, including waterfalls, pie charts, stacked areas, histograms, and treemaps, this collection aims to save users time and effort while enhancing their data visualization capabilities. Additionally, chart collages and dashboards are available, providing users with versatile tools for organizing and presenting their data effectively.
Download this spreadsheet:
Download Excel Format
Copy Google Sheet
Preview


Questions and answers
How can I automate repetitive tasks in a spreadsheet?
Automating repetitive tasks in a spreadsheet can save time and reduce errors. One common method is to use formulas and functions like IF, VLOOKUP, SUMIF, and INDEX MATCH to perform… View full answer
How do I create a dynamic drop-down list in Excel or Google Sheets?
Creating a dynamic drop-down list in Excel or Google Sheets helps in data entry by providing predefined options for users to select from. In Excel, you can use the… View full answer
How can I protect certain cells in a spreadsheet while allowing others to edit?
Protecting certain cells while allowing others to edit is essential for maintaining data integrity in collaborative environments. In Excel… View full answer
How do I create a pivot table to analyze data in Excel or Google Sheets?
A pivot table is a powerful tool that allows users to summarize, analyze, explore, and present large amounts of data quickly. To create a pivot table in Excel, go to the… View full answer
What is conditional formatting, and how can I use it to highlight important data?
Conditional formatting is a feature in spreadsheets that allows users to automatically format cells based on specific criteria. This feature is useful for highlighting… View full answer
Download this spreadsheet:
Download Excel Format
Copy Google Sheet
Applications
Each chart type serves a specific purpose and is optimized for different types of data and analysis. For example, 2D Bar Charts are ideal for representing data categories and highlighting changes over time, while Gantt Charts are invaluable tools for project management, illustrating project schedules and dependencies between tasks. Waterfall Charts are commonly used in finance to visualize changes in values over a series of steps, while Pie Charts are effective for demonstrating proportional data.
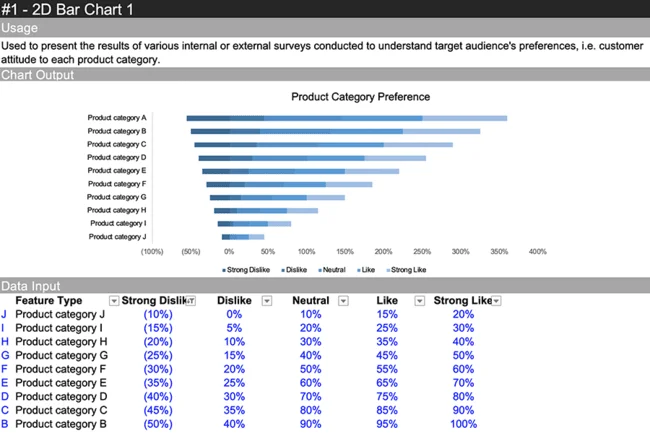
2D Bar Chart
The 2D Bar Chart is a type of chart that represents data using rectangular bars that are proportional to the values they represent. It is typically used to display data categories along one axis (usually the x-axis) and numerical values along the other axis (usually the y-axis). Each bar in the chart corresponds to a category, and the length of the bar represents the value of that category. The 2D Bar Chart is effective for comparing data across different categories and identifying trends or patterns within the data. It is commonly used in various fields such as finance, marketing, and project management to visualize quantitative data in a clear and concise manner.
Horizontal Bar Chart
The Horizontal Bar Chart, also known as a bar graph, is similar to the 2D Bar Chart but with the bars oriented horizontally instead of vertically. It is used to display data categories along the vertical axis and numerical values along the horizontal axis. Each bar in the chart corresponds to a category, and the length of the bar represents the value of that category. The Horizontal Bar Chart is particularly useful for comparing data across different categories, especially when the category labels are long or when there are many categories to display. It is commonly used in market research, financial analysis, and performance evaluation to visualize data in a clear and easy-to-understand format.

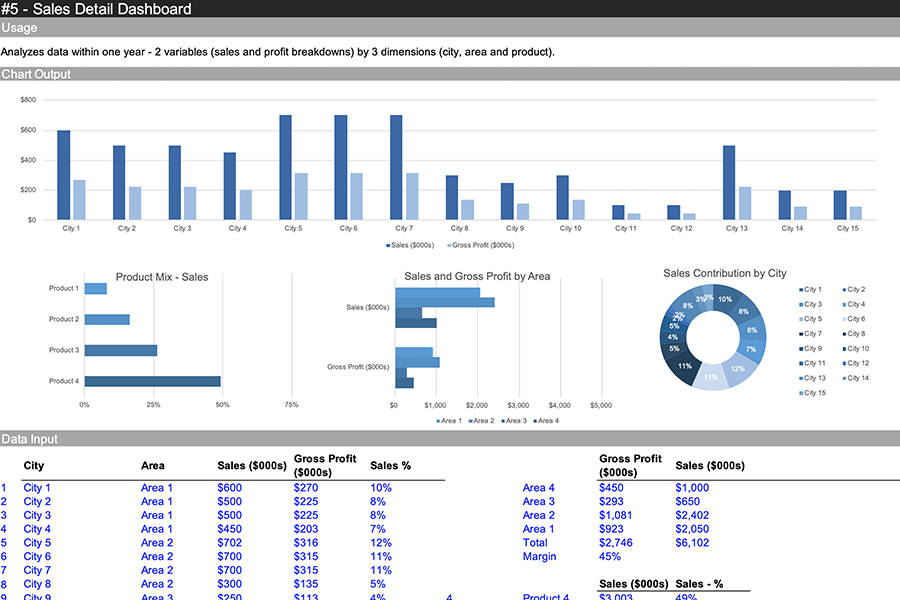
Sales Overview Dashboard Excel
The Sales Overview Dashboard is a visual representation of sales-related data and metrics, designed to provide a comprehensive view of sales performance and trends. It typically includes key performance indicators (KPIs) such as total revenue, sales growth, customer acquisition, and conversion rates. The dashboard may also feature interactive charts, graphs, and tables that allow users to drill down into specific metrics and analyze sales data at a granular level. By consolidating essential sales information into one centralized location, the Sales Overview Dashboard enables sales teams, managers, and executives to monitor performance, identify opportunities, and make informed decisions to drive business growth.

Download this spreadsheet template:
Download Excel Format
Copy Google Sheet
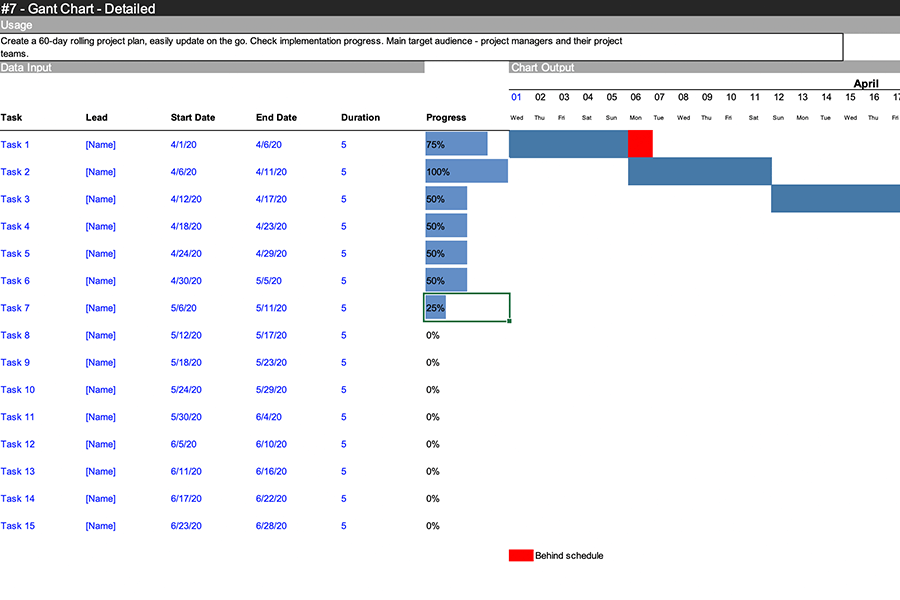
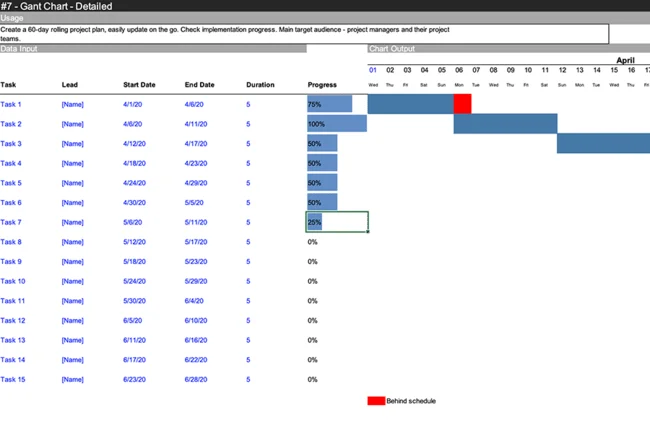
Gantt Chart
The Gantt Chart is a versatile tool for project management, illustrating project schedules, timelines, task dependencies, and current project status. By visually representing the sequence and duration of tasks, the Gantt Chart enables project managers to effectively plan, monitor, and control project activities. With its clear and intuitive layout, it facilitates communication among project team members and stakeholders, ensuring everyone is aligned on project objectives and timelines. Whether used for scheduling, resource allocation, or progress tracking, the Gantt Chart is an indispensable tool for managing projects of any size or complexity.
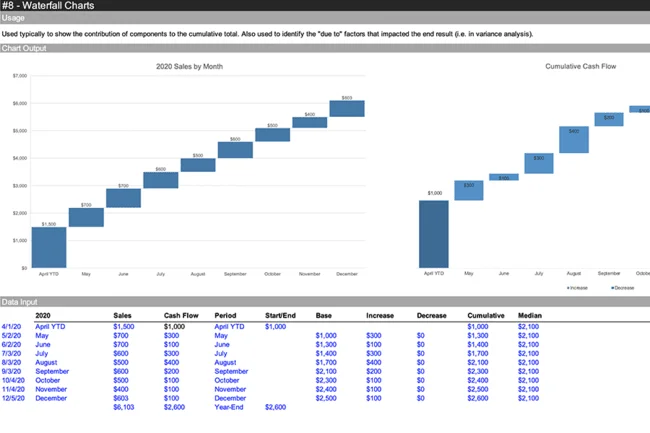
Waterfall Charts
Waterfall Charts are used to visually illustrate how a starting value evolves into a final value through a series of intermediate additions and subtractions. Commonly used in finance, Waterfall Charts provide a clear and concise representation of financial data, including revenue, expenses, and net income. By breaking down the components of a financial metric and showing their cumulative effect, Waterfall Charts help users understand the drivers behind changes in financial performance. With their intuitive design and easy-to-interpret layout, Waterfall Charts are valuable tools for financial analysis, budgeting, and reporting purposes.
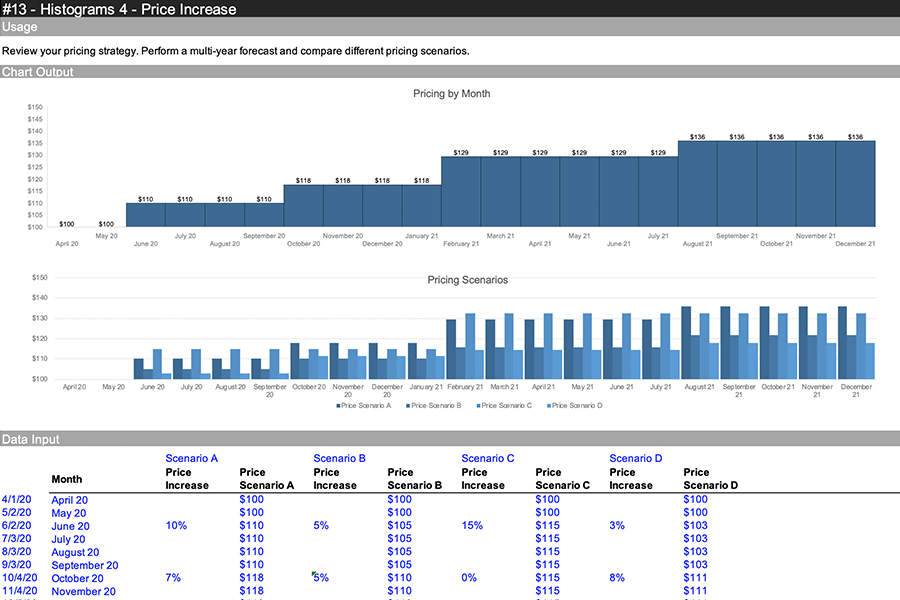
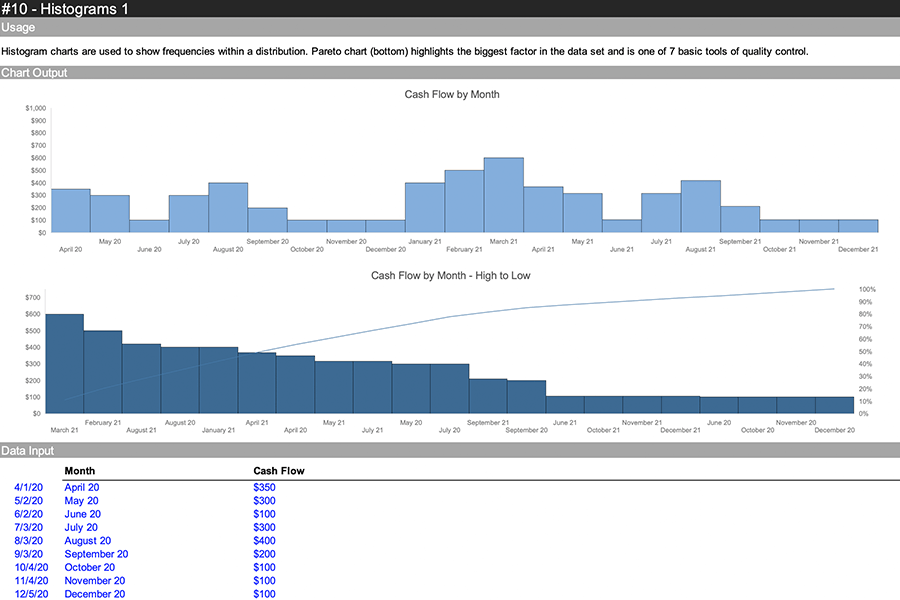
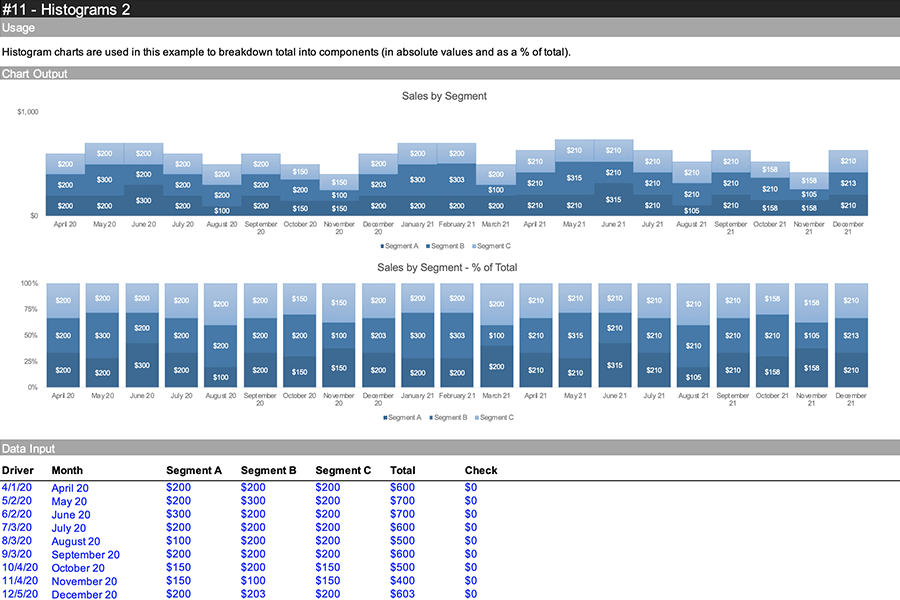
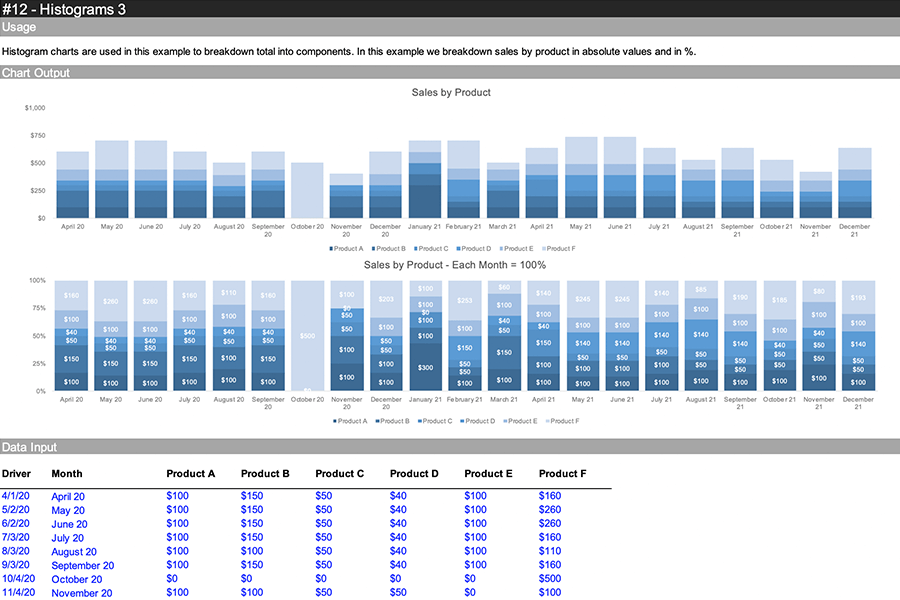
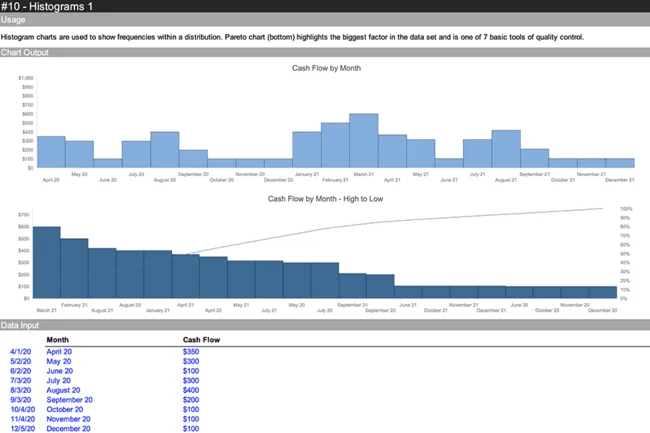
Histograms
Histograms are graphical representations of the distribution of data, showing the frequency or count of observations within different intervals or bins. They consist of a series of adjacent bars, where the height of each bar corresponds to the frequency of observations within that interval. Histograms are commonly used to visualize the shape, center, and spread of a dataset, allowing users to identify patterns, outliers, and trends in the data. They are widely used in statistics, data analysis, and quality control to explore and understand the underlying distribution of a variable and make data-driven decisions based on the insights gained from the histogram.
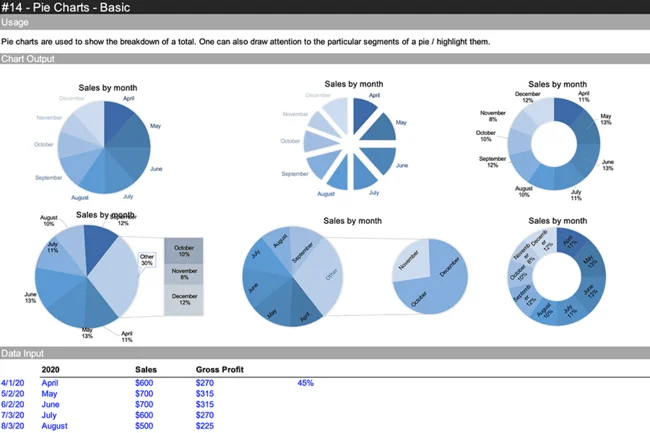
Pie Charts Excel
Pie Charts are circular statistical graphics that display data as slices of a circle, with each slice representing a proportion of the whole. The size of each slice is proportional to the value it represents relative to the total. Pie Charts are commonly used to illustrate the distribution of a categorical variable or show the composition of a dataset. They are particularly effective for displaying data with a small number of categories and highlighting the relative sizes of each category. Pie Charts are widely used in market research reports, and academic publications to visually communicate percentages, proportions, and shares of a total.
Download this ultimate spreadsheet charts:
Download Excel Format
Copy Google Sheet
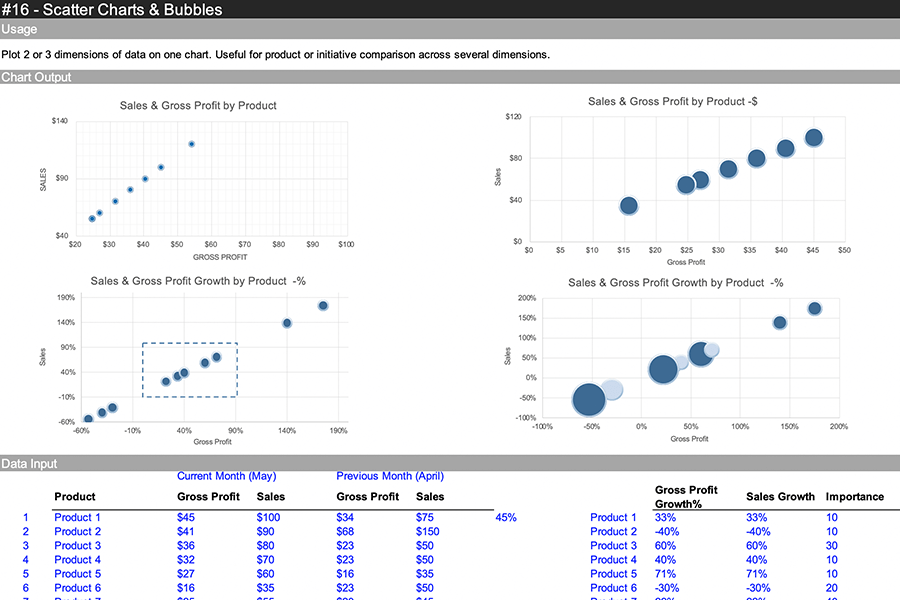
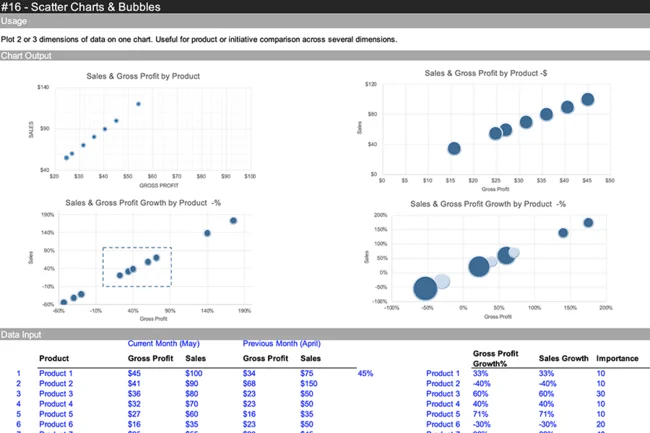
Scatter Charts
Scatter Charts, also known as Scatter Plots or Scatter Graphs, are graphical representations of data points plotted on a Cartesian coordinate system. Each data point is represented by a dot, with its position determined by the values of two variables. Scatter Charts are used to visualize the relationship between two continuous variables and identify any patterns or correlations in the data. They are particularly useful for detecting trends, clusters, or outliers in the data and assessing the strength and direction of the relationship between the variables. Scatter Charts are commonly used in scientific research, engineering analysis, and data exploration to explore the relationships between variables and make data-driven decisions based on the insights gained from the chart.
Bubble Charts
Bubble Charts are a variation of Scatter Charts that represent data points as bubbles or circles, with the size of each bubble corresponding to a third variable. In addition to the x and y axes used in Scatter Charts, Bubble Charts include a third axis (usually represented by the size of the bubbles) to represent the magnitude or value of the third variable. Bubble Charts are used to visualize three variables simultaneously and explore relationships between them. They are particularly effective for displaying complex datasets with multiple dimensions and identifying patterns or trends in the data. Bubble Charts are commonly used in economics, finance, and data analysis to visualize multidimensional data and identify correlations or outliers.
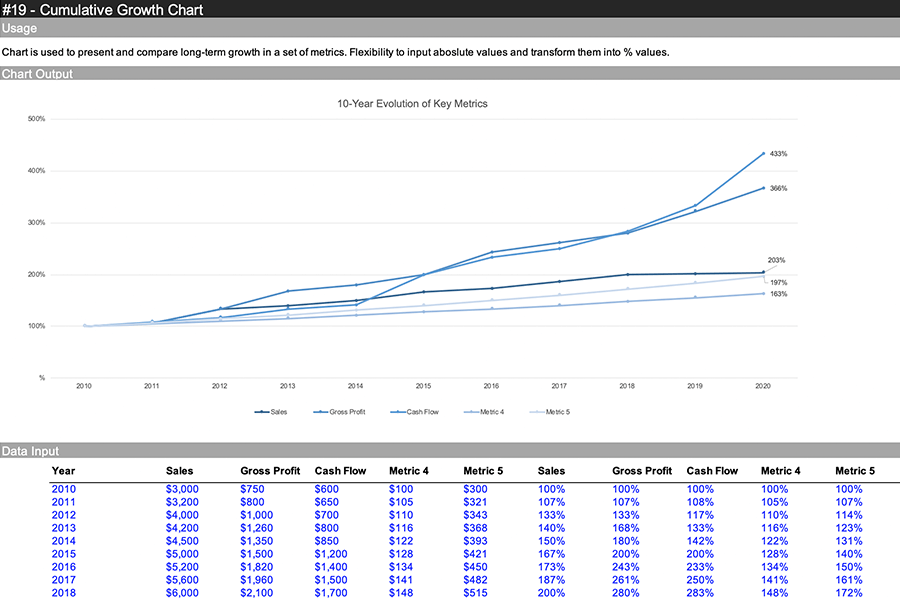
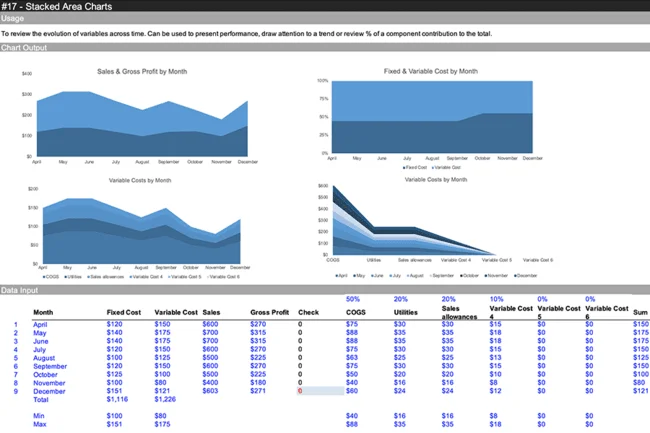
Stacked Area Charts
Stacked Area Charts are a type of area chart that displays the cumulative contribution of multiple data series over time. Each data series is represented by a colored area, stacked on top of each other to show the total value at each point in time. Stacked Area Charts are used to visualize part-to-whole relationships and illustrate how each category or data series contributes to the cumulative total. They are particularly effective for showing changes in composition or distribution over time and identifying trends or patterns in the data. Stacked Area Charts are commonly used in finance, marketing, and environmental science to analyze time series data and communicate insights about the underlying trends or dynamics.
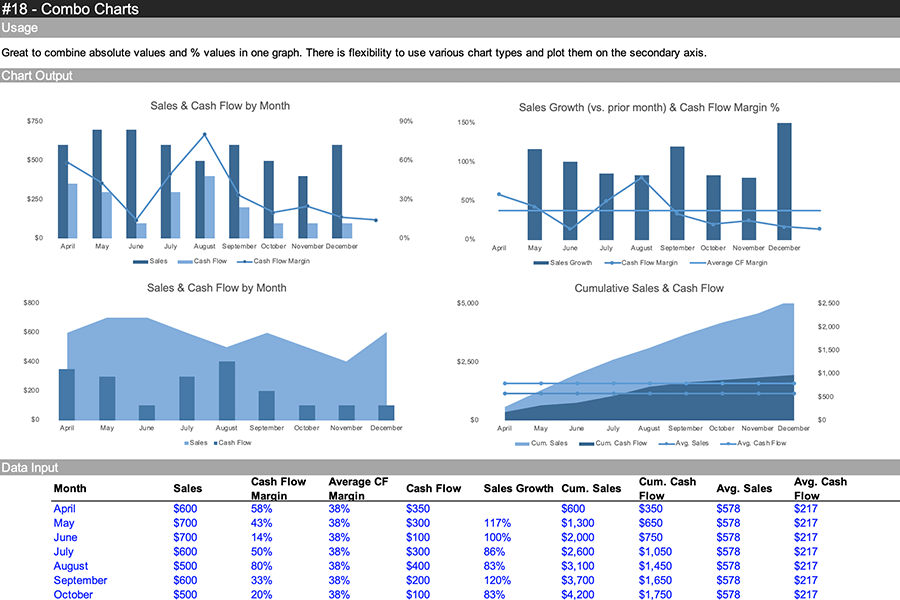
Combo Charts
Combo Charts combine two or more different types of charts (such as line charts, bar charts, or area charts) into a single chart to visualize multiple datasets or variables simultaneously. Each data series is represented using a different chart type, allowing users to compare different types of data on the same chart. Combo Charts are used to visualize complex datasets with multiple dimensions or variables and identify relationships or trends between them. They are particularly effective for comparing data series with different scales or units of measurement and communicating insights about the relationships between variables. Combo Charts are commonly used in financial reports, and scientific research to visualize multidimensional data and make data-driven decisions based on the insights gained from the chart.

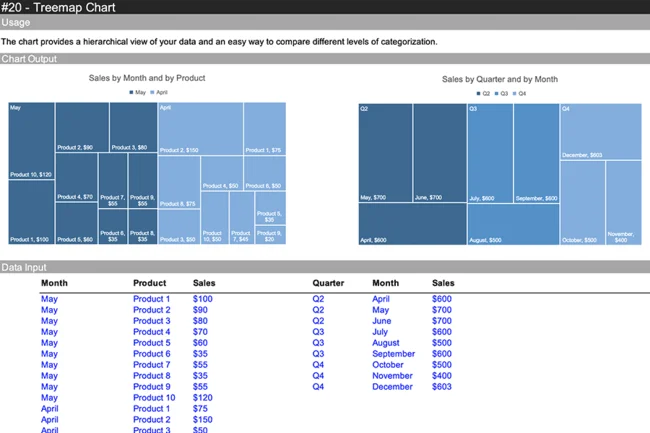
Treemap Chart
Treemap Charts are hierarchical visualizations that represent data as nested rectangles, with each rectangle representing a category or subgroup and its size proportional to a specific metric (such as revenue, population, or market share). The rectangles are organized into a tree-like structure, with larger rectangles subdivided into smaller rectangles to represent subcategories or subgroups. Treemap Charts are used to visualize hierarchical data structures and show the relationships between categories or subgroups. They are particularly effective for displaying large and complex datasets in a compact and intuitive format and identifying patterns or trends in the data. Treemap Charts are commonly used in finance, data visualization, and information technology to explore hierarchical relationships, compare different categories, and analyze the distribution of resources or values.
Ultimate Charts Template
The Ultimate Charts Template is designed to simplify data visualization and analysis. With a wide range of chart types available, including 2D Bar Charts, Horizontal Bar Charts, Gantt Charts, Waterfall Charts, Histograms, Pie Charts, Scatter Charts, Bubble Charts, Stacked Area Charts, Combo Charts, and Treemap Charts, users can easily create professional-quality visualizations for various purposes. Each chart type is accompanied by clear explanations of its purpose and application, making it easy for users to select the most suitable chart for their data. Additionally, the template offers customizable features, allowing users to tailor charts to their specific needs and preferences. Whether it’s project management, sales analysis, or financial tracking, the Ultimate Charts Spreadsheet Template provides the tools needed to effectively visualize and analyze data.
Conclusion
In conclusion, the Ultimate Charts Spreadsheet offers a versatile collection of chart templates and visualization tools to simplify data analysis. With a variety of chart types available, users can create professional-quality charts and dashboards for project management, sales analysis, and financial tracking. Customizable features allow users to tailor charts to their specific needs, while clear explanations ensure ease of understanding. Ultimately, the Ultimate Charts Spreadsheet is a valuable resource for professionals seeking to visualize data effectively and make informed decisions.
Questions and answers
How do I merge data from multiple sheets into one in Excel or Google Sheets?
Merging data from multiple sheets into one can be accomplished using various methods depending on the complexity of the data. In Excel, you can use functions like… View full answer
How can I remove duplicates from a spreadsheet?
Removing duplicates from a spreadsheet is a common task to clean up data and ensure accuracy. In Excel, you can use the “Remove Duplicates” feature under … View full answer
How do I create a dashboard in Excel or Google Sheets for real-time data analysis?
Creating a dashboard in Excel or Google Sheets allows users to visualize data and monitor key metrics in real time. To build a dashboard, start by… View full answer
How do I use Excel formulas to calculate growth rate?
Calculating the growth rate in Excel can be done using simple formulas. The basic formula to calculate growth rate is… View full answer
How do I create interactive charts that update automatically in Excel or Google Sheets?
Creating interactive charts that update automatically helps users stay on top of their data without having to manually refresh or update charts… View full answer
Download Ultimate Charts Spreadsheet:
Download Excel Format
Copy Google Sheet