Profit and Loss Statement Template – Free Spreadsheet Download
- Techriv
- April 1, 2024
- Entrepreneurship
- 0 Comments
Introduction:
Struggling to manage your business finances effectively? We understand. That’s why we’ve created an easy-to-use Profit and Loss Statement template, compatible with Excel and Google Sheets. Say goodbye to financial confusion and hello to clarity. Our template streamlines financial tracking, automates key calculations, and provides clear visualizations, empowering you to make informed decisions with confidence. Take the hassle out of financial management—download our template today and take control of your business finances effortlessly.
Download this spreadsheet:
Download Excel Format
Copy Google Sheet
Preview


Download this spreadsheet:
Download Excel Format
Copy Google Sheet
Introduction to Financial Challenges
Are you a business owner, entrepreneur, or freelancer struggling to manage your finances and monitor your business performance? Balancing transactions, financial metrics, and cash flow can be challenging. In fact, 82% of small businesses fail due to poor cash flow management and a lack of understanding of financial metrics. That’s why we’ve developed a Profit and Loss Statement template spreadsheet template in Excel and Google Sheets that you can download and customize to your needs right now.

Simplifying Financial Tracking Spreadsheet
This Profit and Loss Statement template simplifies financial tracking and helps you make informed decisions for the future. It features a cash flow overview, complete statement layout, monthly and quarterly results, a clear distribution of expenses and income, and a comparison of business performance over time. Plus, it automatically calculates key metrics like net profit, margin, and growth, and compares actual results against projections with a handy dashboard.
Overview of Profit and Loss Statement Excel
Profit and Loss statements, also known as income statements, are documents that provide an overview of a company’s revenues, expenses, and net profit (or loss) over a specific period. Since this can vary between a quarterly view or a yearly view, they’re helpful to evaluate revenue generation and expense management, identify trends in sales, costs, and profitability, monitor the effectiveness of pricing and marketing strategies, and assess overall financial performance to compare against your previous performance or industry benchmarks.
Download this spreadsheet template:
Download Excel Format
Copy Google Sheet
Utilizing the Statement Tab
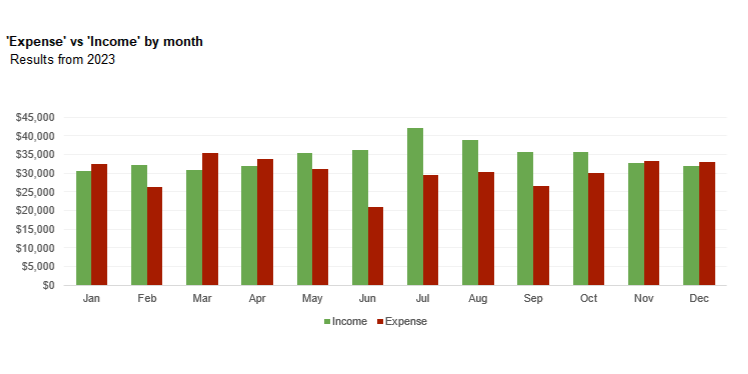
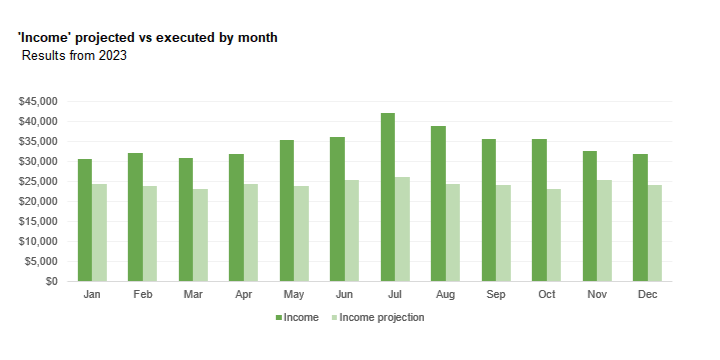
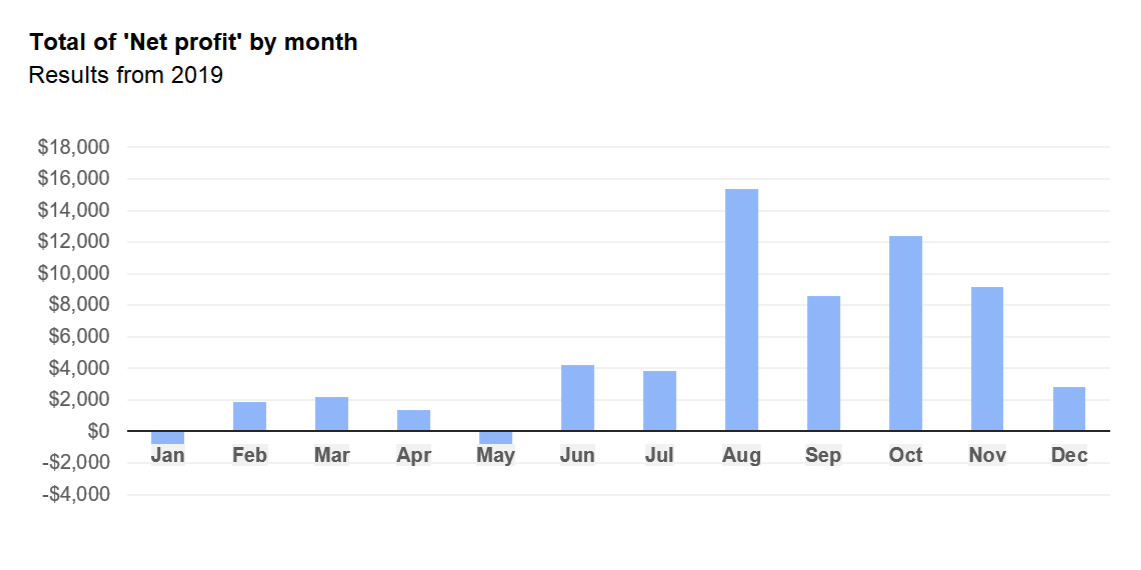
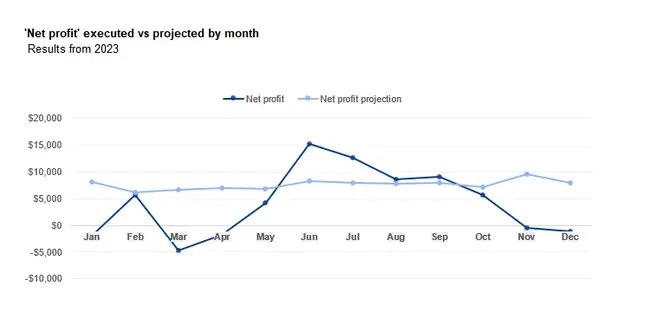
The Statement tab is where you’ll monitor your cash flow based on income, expenses, and profit. Simply enter the year to filter the data, and all the information is automatically displayed in one place. To help visualize performance, the charts on this tab display key results like total expenses and income earned, total monthly profit, and the annual projection versus actual performance. This allows you to spot trends for your business.

Dashboard Overview
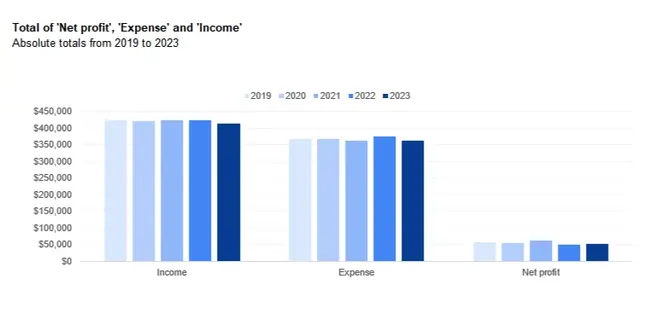
The Dashboard tab is perfect for in-depth analysis so you can make proactive, data-driven decisions. Enter the year you want to filter the data, and you’ll have a complete set of essential charts to support your strategies and decision-making. First, the “cash flow overview” displays all crucial results and compares them against the total annual projection.

Granular Analysis with Transaction Details
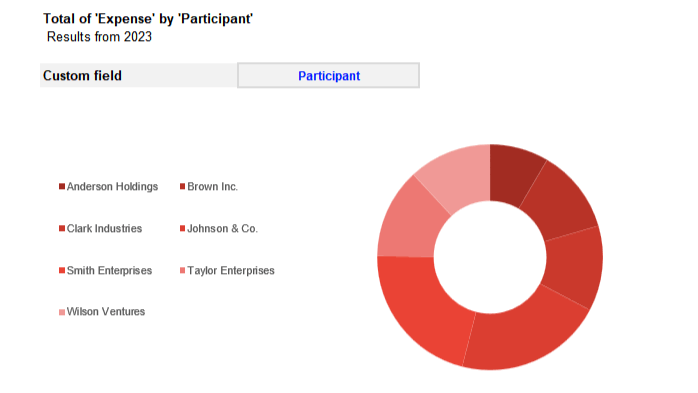
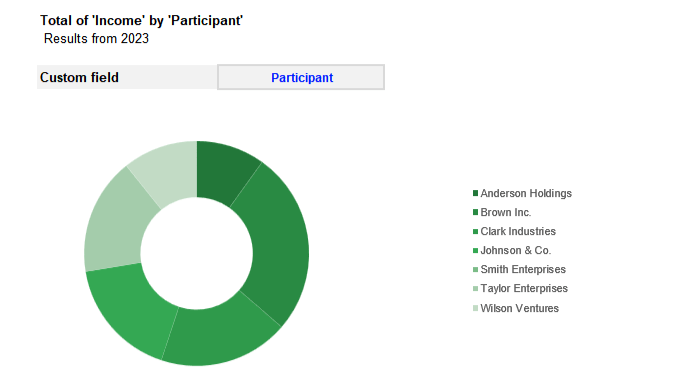
After analyzing the year, it’s time to determine where your expenses and income are coming from. The transaction details section shows your top categories for both income and expenses, which can be analyzed for the total amount of all months or each specific month. This helps you track budget trends and make better decisions about cutting costs or increasing revenue.

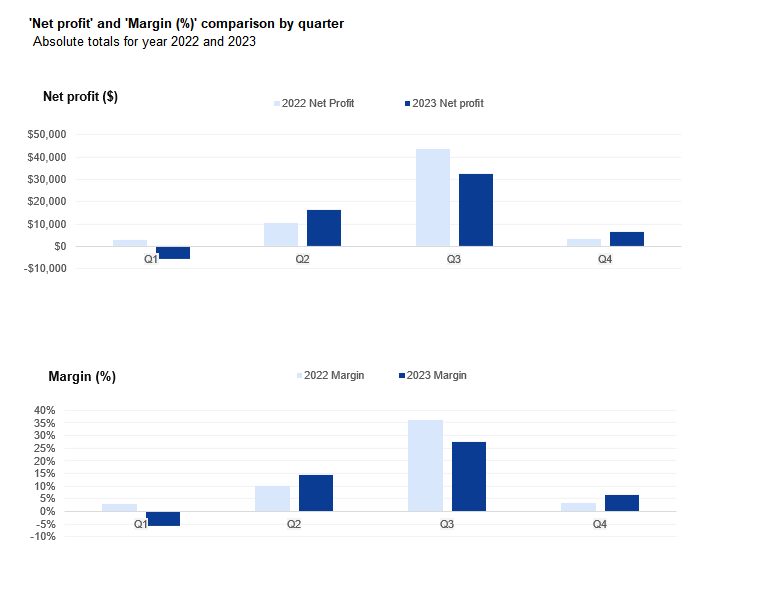
Switching Views for In-depth Analysis
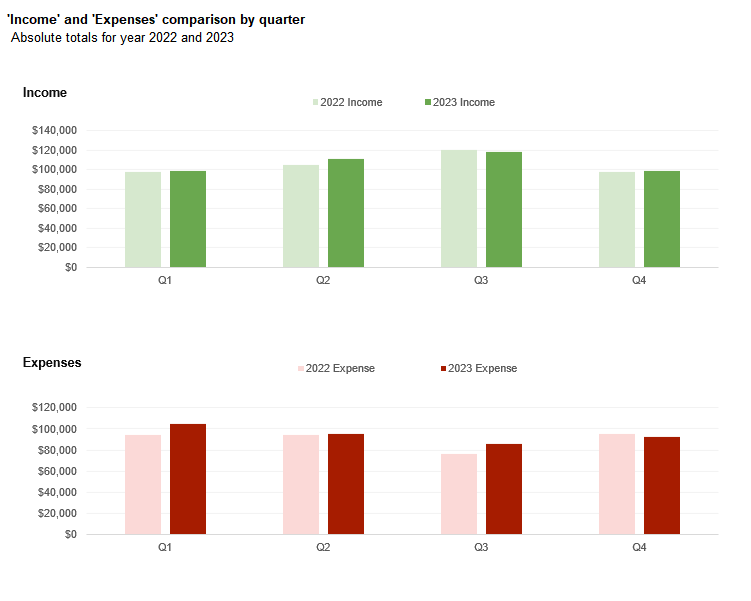
For optimal analysis, switch between quarterly or annual views. In the profit and loss comparison section, stay updated on your business performance by comparing the outcomes of your expenses, income, profit margin, and company growth in a quarterly view against the previous year.
Visualize Your Financial Data Excel
Visualizations are a powerful tool for gaining insights into your business’s financial health. Our Profit and Loss Statement template features a range of visualizations, including charts, graphs, and tables, that provide a clear and intuitive overview of your financial data. From identifying trends to spotting outliers, these visualizations make it easy to interpret complex financial information at a glance.
Profit and Loss Statement Template
Our Profit and Loss Statement template is a user-friendly tool designed to streamline your financial tracking process. Whether you’re a seasoned entrepreneur or just starting out, managing your company’s finances can be daunting. Our template aims to simplify this task, providing you with a clear overview of your business’s revenues, expenses, and net profit (or loss) over a specific period.
Key Features:
-
Comprehensive Layout: The template features a comprehensive layout that organizes your financial data in a clear and structured manner. From income streams to expense categories, everything is neatly categorized for easy reference.
-
Automatic Calculations: Say goodbye to manual calculations! Our template automatically computes key financial metrics such as net profit, gross profit margin, and operating expenses. This saves you time and minimizes the risk of errors.
-
Customizable Time Frames: Whether you prefer a monthly, quarterly, or yearly view, our template allows you to customize the time frame according to your needs. This flexibility enables you to track your financial performance over different periods and identify trends more effectively.
-
Visualizations: Visual representations such as charts and graphs provide a clear visual overview of your financial data. This makes it easier to identify patterns, trends, and areas that require attention.
-
Comparative Analysis: Our template facilitates comparative analysis by allowing you to compare your actual financial results against budgeted or projected figures. This helps you gauge the effectiveness of your financial strategies and make informed decisions for the future.
-
Accessibility: Compatible with both Microsoft Excel and Google Sheets, our template ensures accessibility across different platforms. Whether you prefer desktop or cloud-based software, you can access your financial data anytime, anywhere.
Conclusion:
Our Profit and Loss Statement template is a powerful tool that empowers you to take control of your business’s finances with confidence. By simplifying financial tracking, automating calculations, and providing clear visualizations, our template enables you to make informed decisions that drive your business forward. Download our template today and embark on a journey towards financial clarity and success.
Download Profit and Loss Statement Spreadsheet:
Download Excel Format
Copy Google Sheet