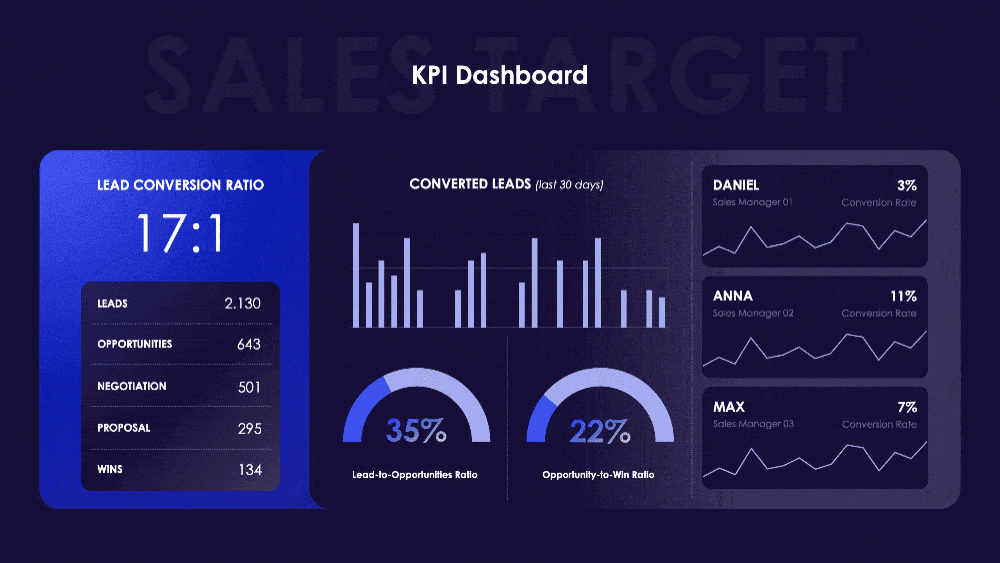
How can KPI dashboards help in tracking sales performance?
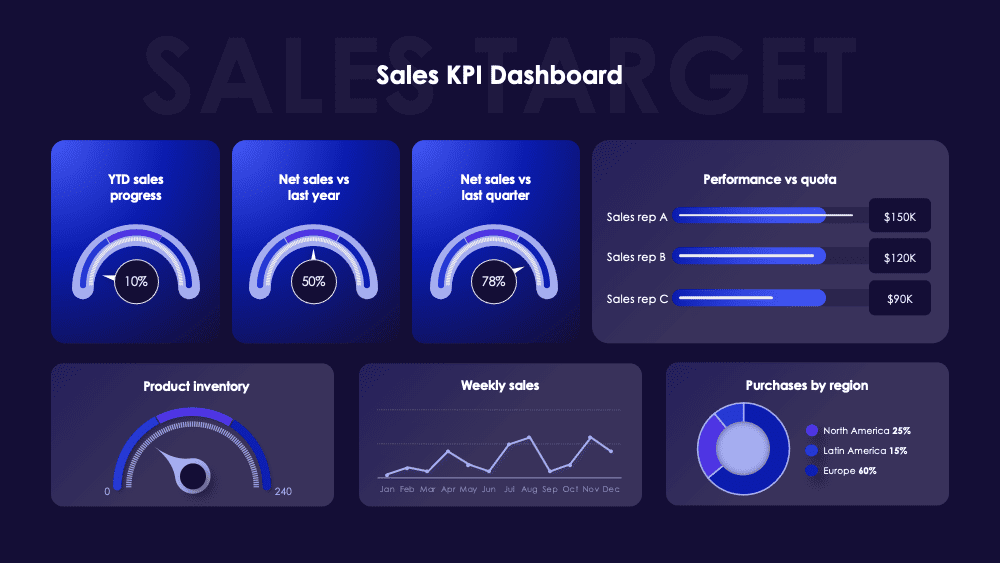
KPI (Key Performance Indicator) dashboards visualize important sales metrics, providing real-time insights into sales performance. They help track metrics like lead conversion ratios, sales reps’ performance, and overall sales progress. By presenting data in an easy-to-understand format, dashboards enable sales teams to monitor their performance, make informed decisions, and stay aligned with sales targets. This helps improve efficiency and effectiveness in achieving sales goals.
Question related to this presentation:
Sales Strategies Toolkit Presentation
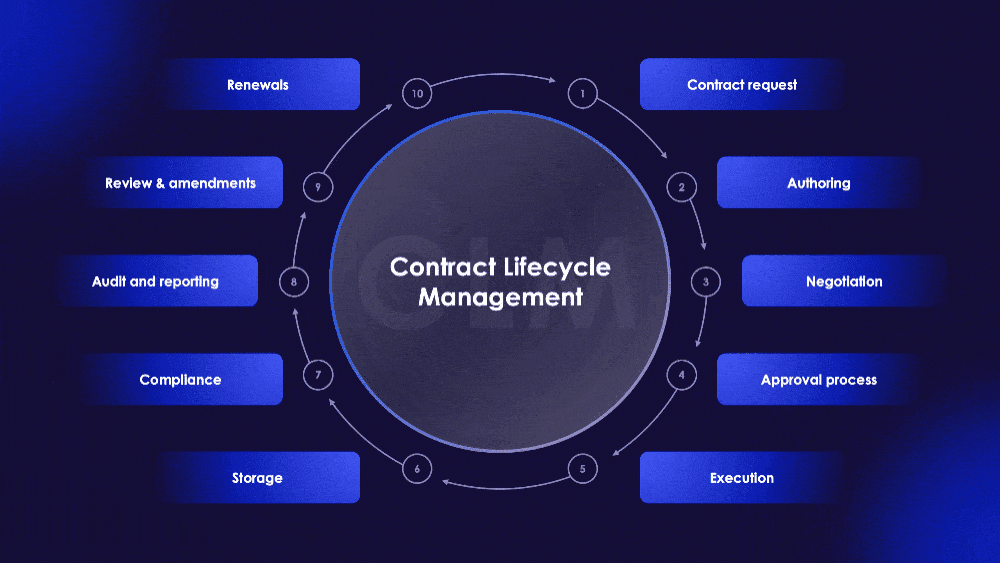
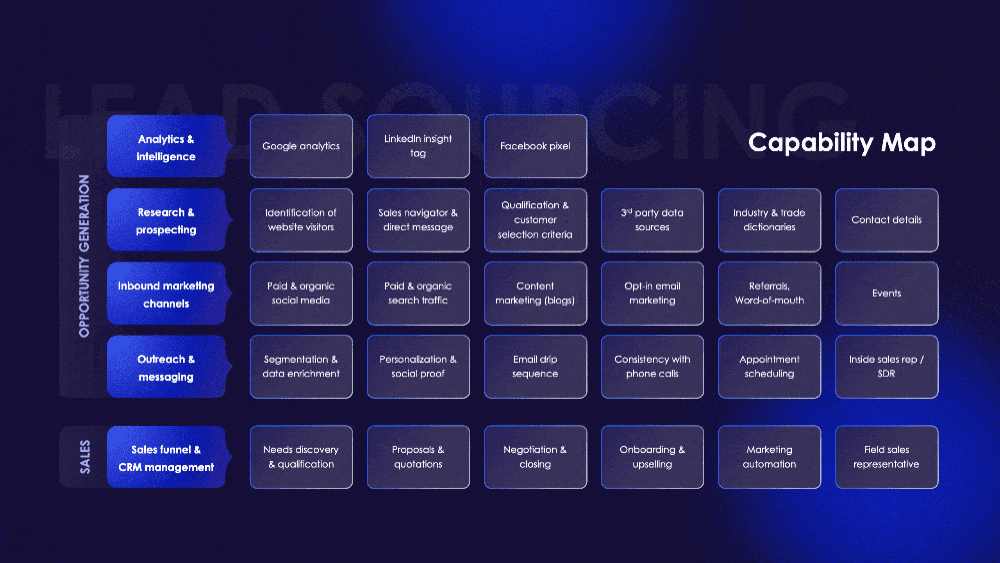
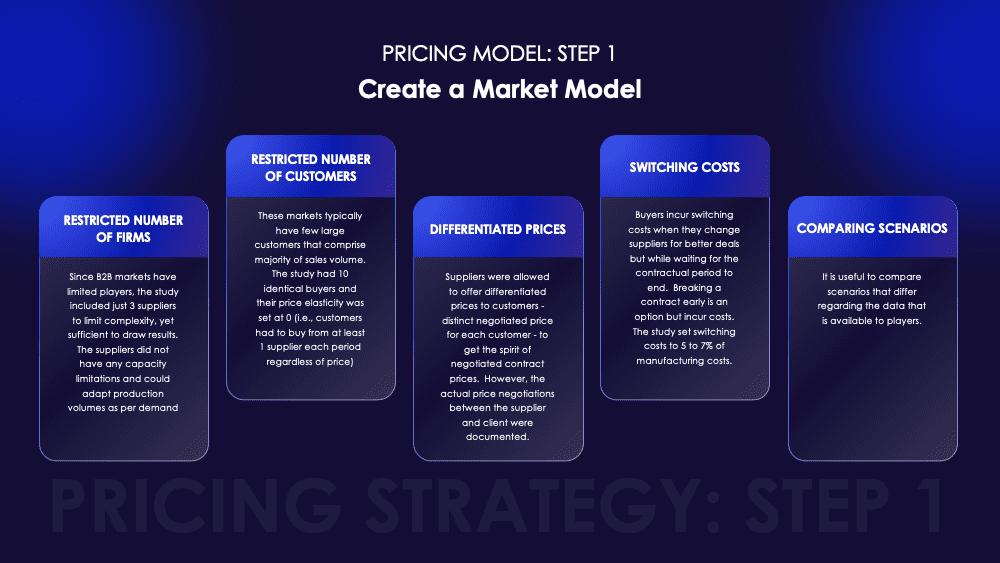
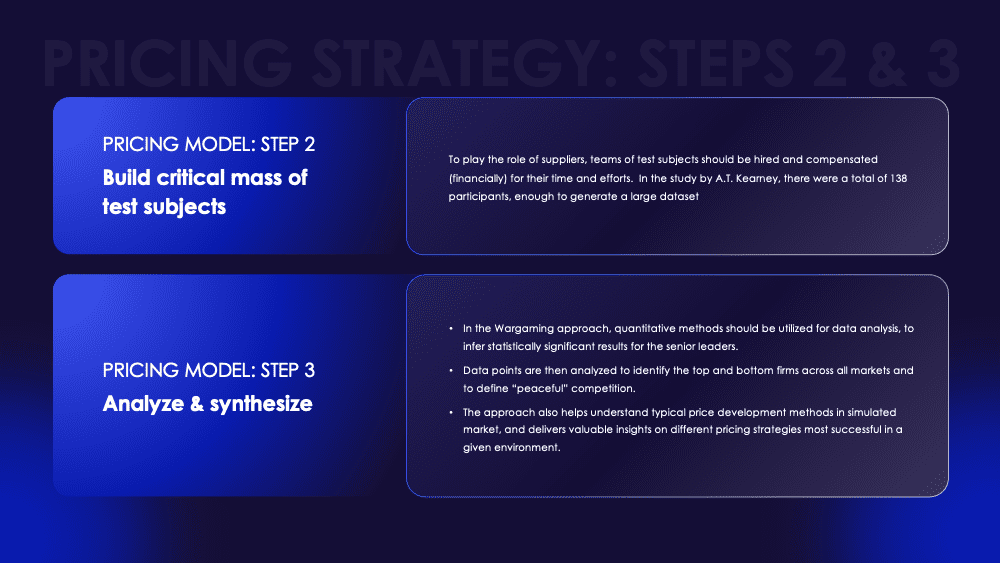
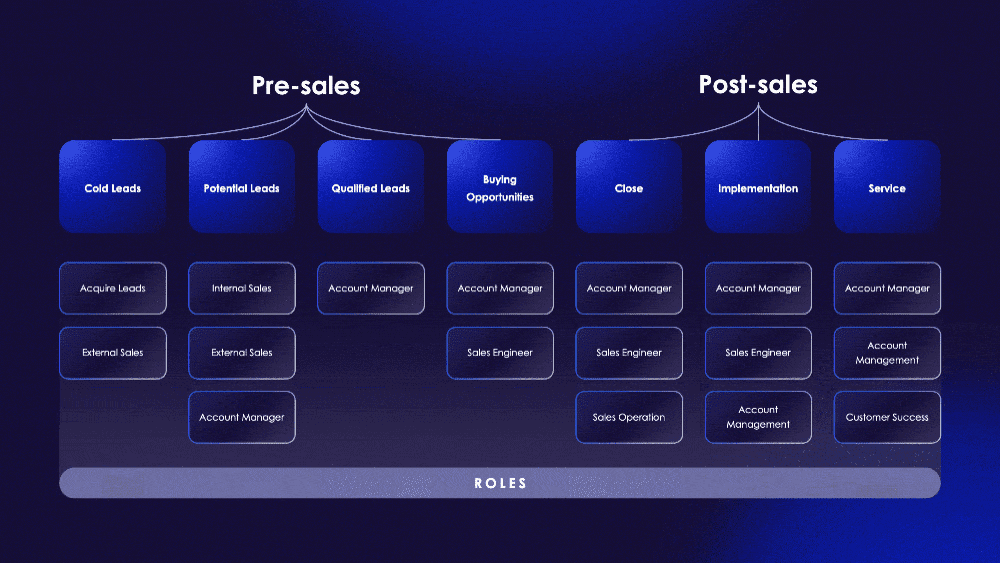
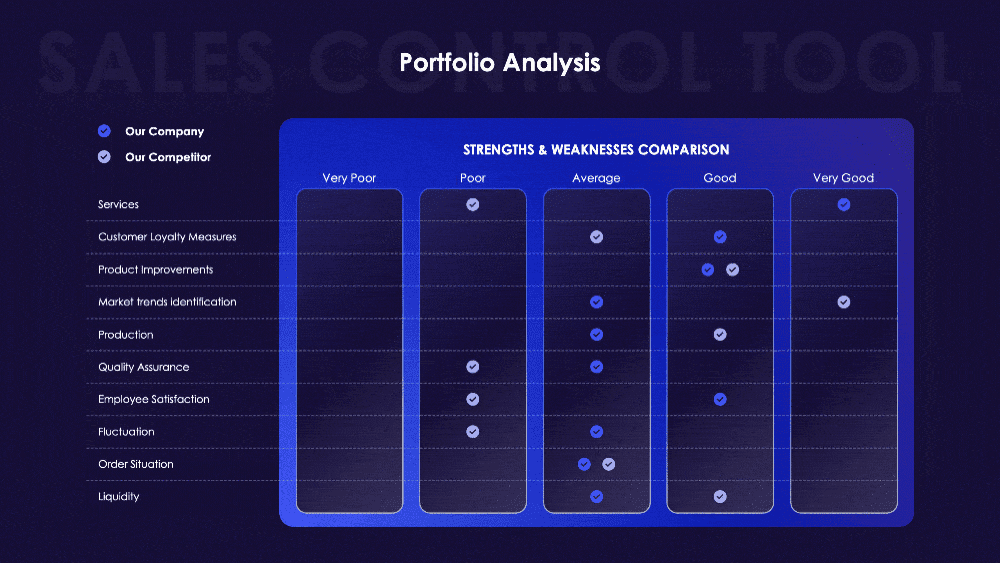
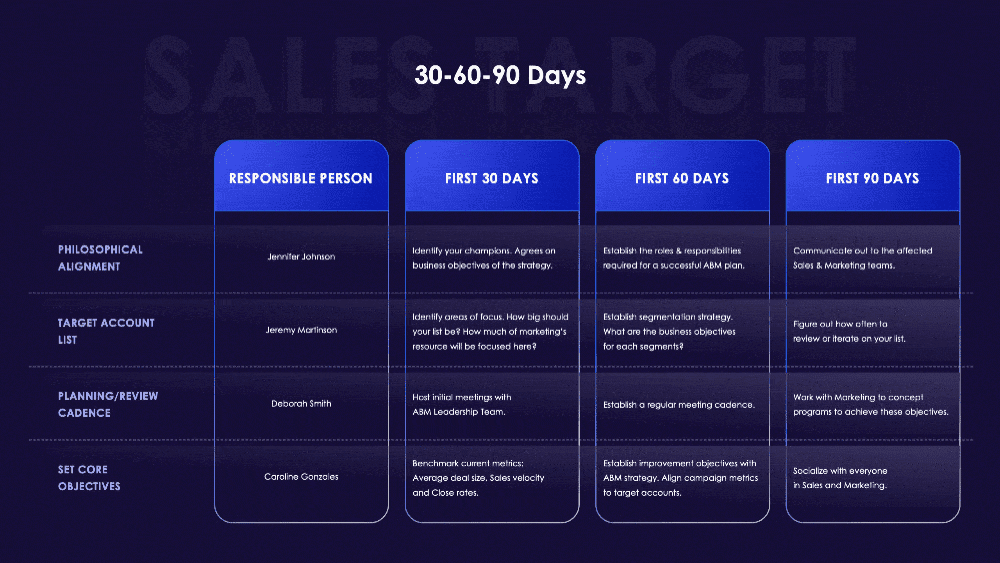
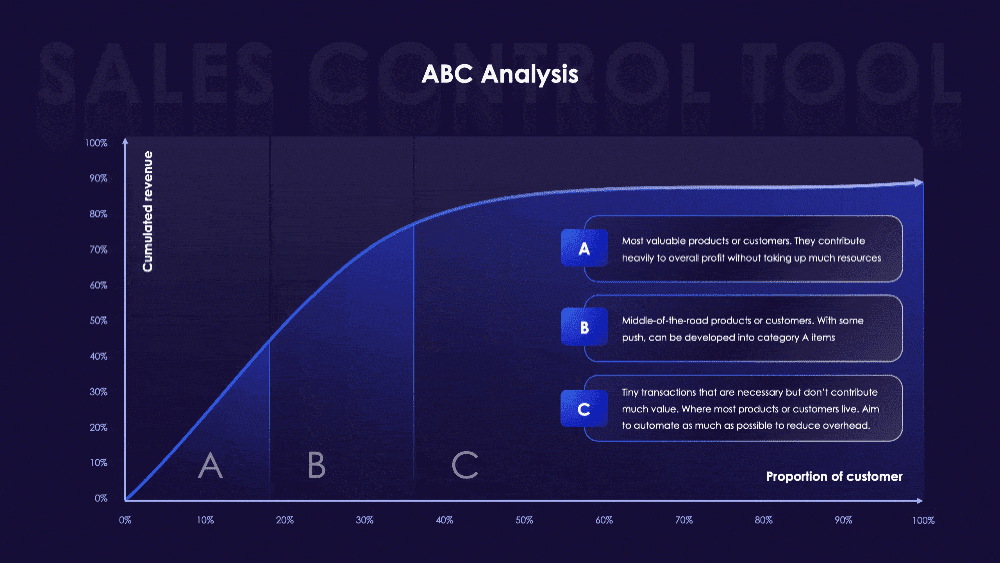
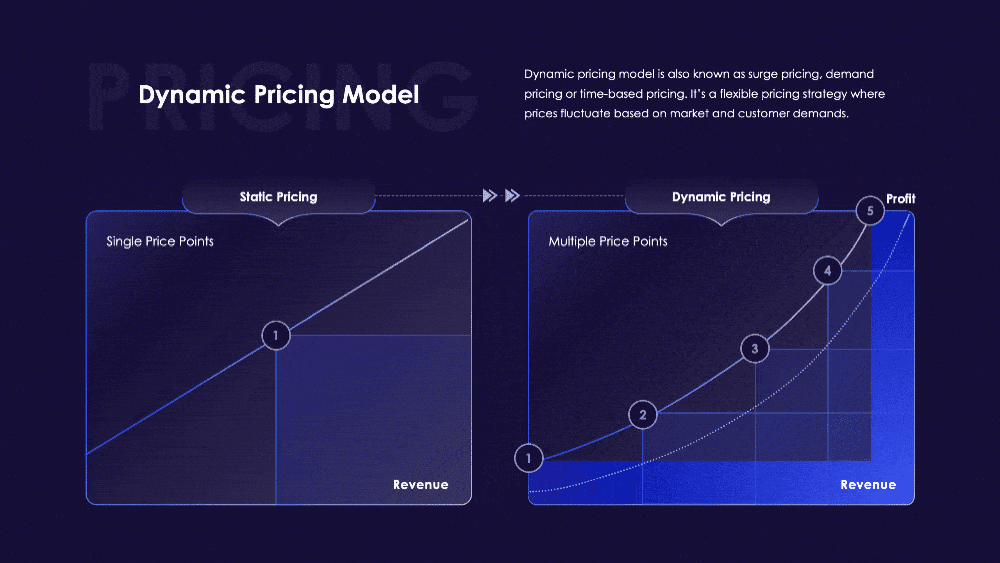
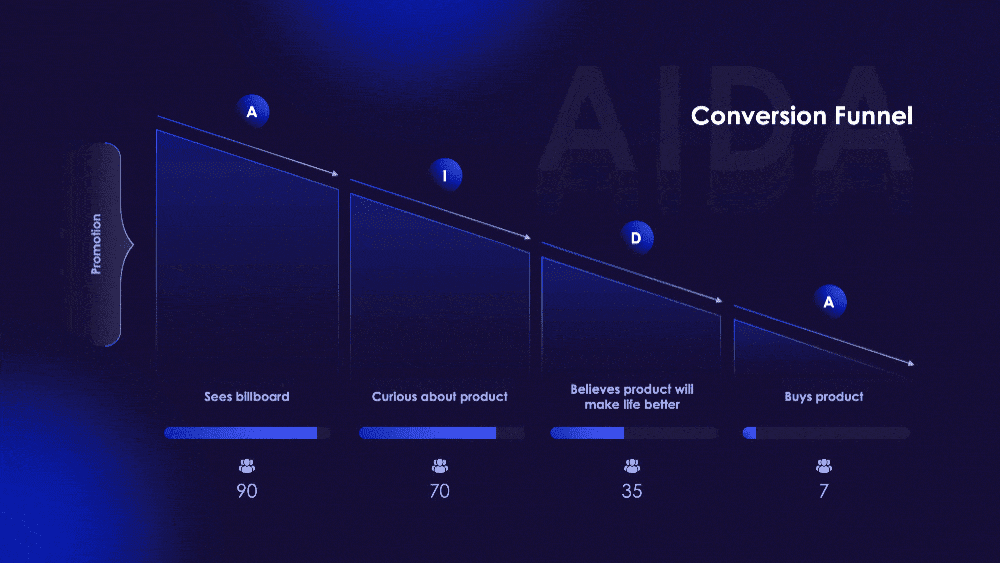
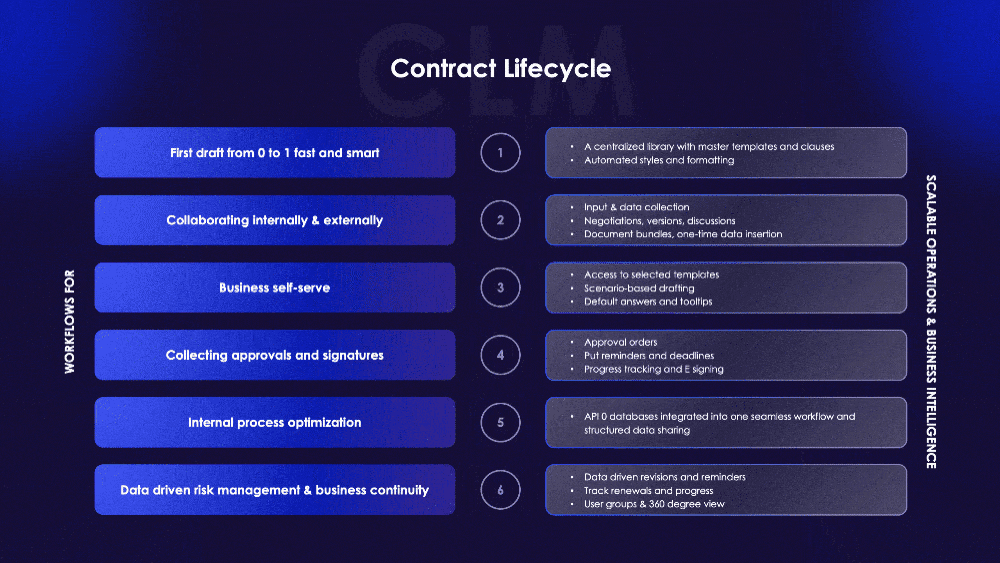
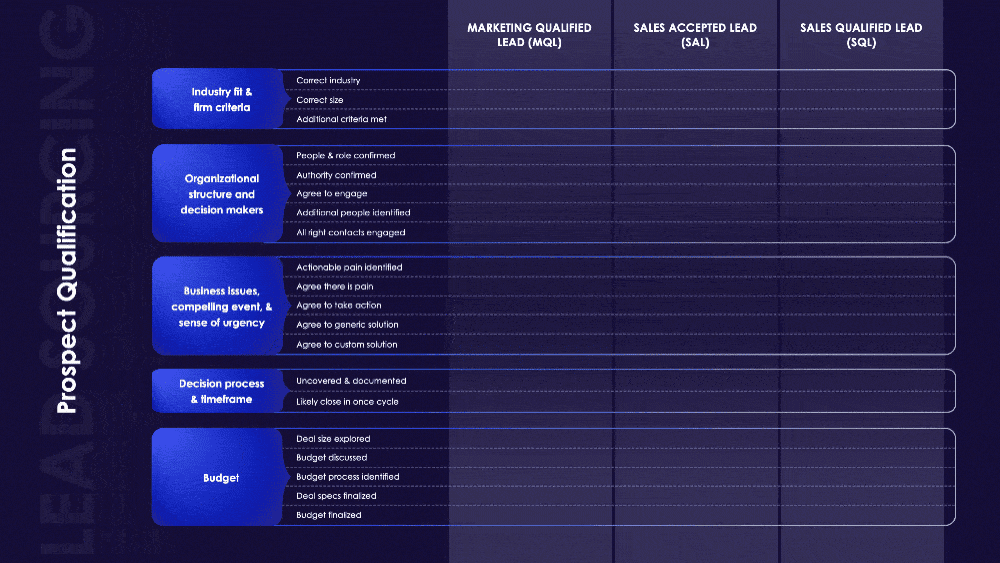
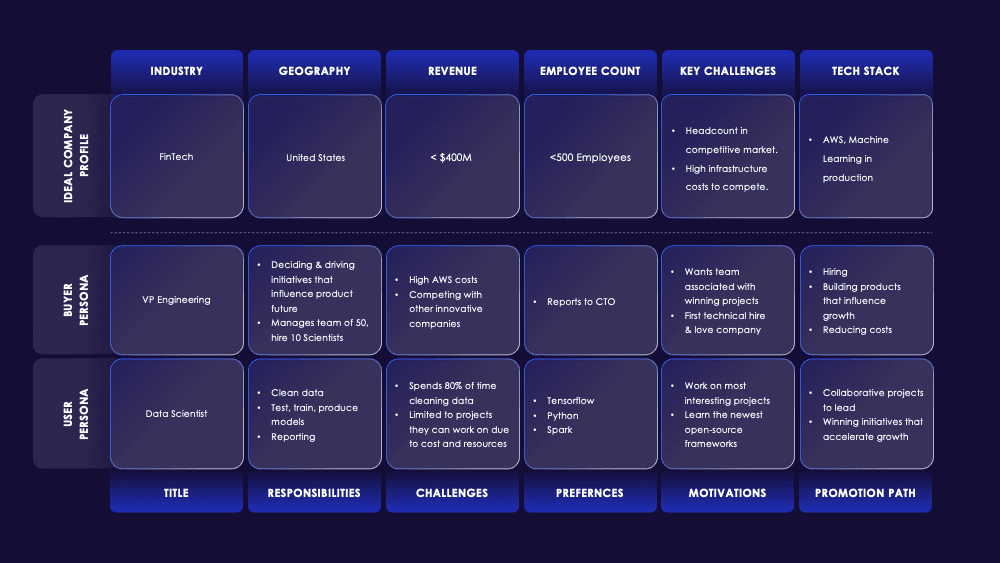
Strategies Toolkit Presentation addresses the challenges of today’s competitive market where achieving sales targets can be daunting. Misqualified leads, ineffective pricing strategies, and poor sales controls often lead to missed opportunities and revenue loss. To help overcome these challenges, we have compiled a toolkit that includes best practices and frameworks to enhance your sales efforts. This toolkit covers dynamic pricing models, prospect qualification techniques, contract lifecycle management, ABC analysis, and more. By implementing these strategies, your team can streamline the sales process, maximize revenue, and stay ahead of the competition.
Download this presentation:
Download Powerpoint PPT
Download Google Slides
Download Apple Keynote
Presentation Preview


Download this presentation:
Download Powerpoint PPT
Download Google Slides
Download Apple Keynote
Related:
Pricing Strategies Spreadsheet
Financial Statements Presentation
Marketing Dashboard Spreadsheet
Profit and Loss Statement