How can I customize reports in a bookkeeping dashboard to fit my business needs?
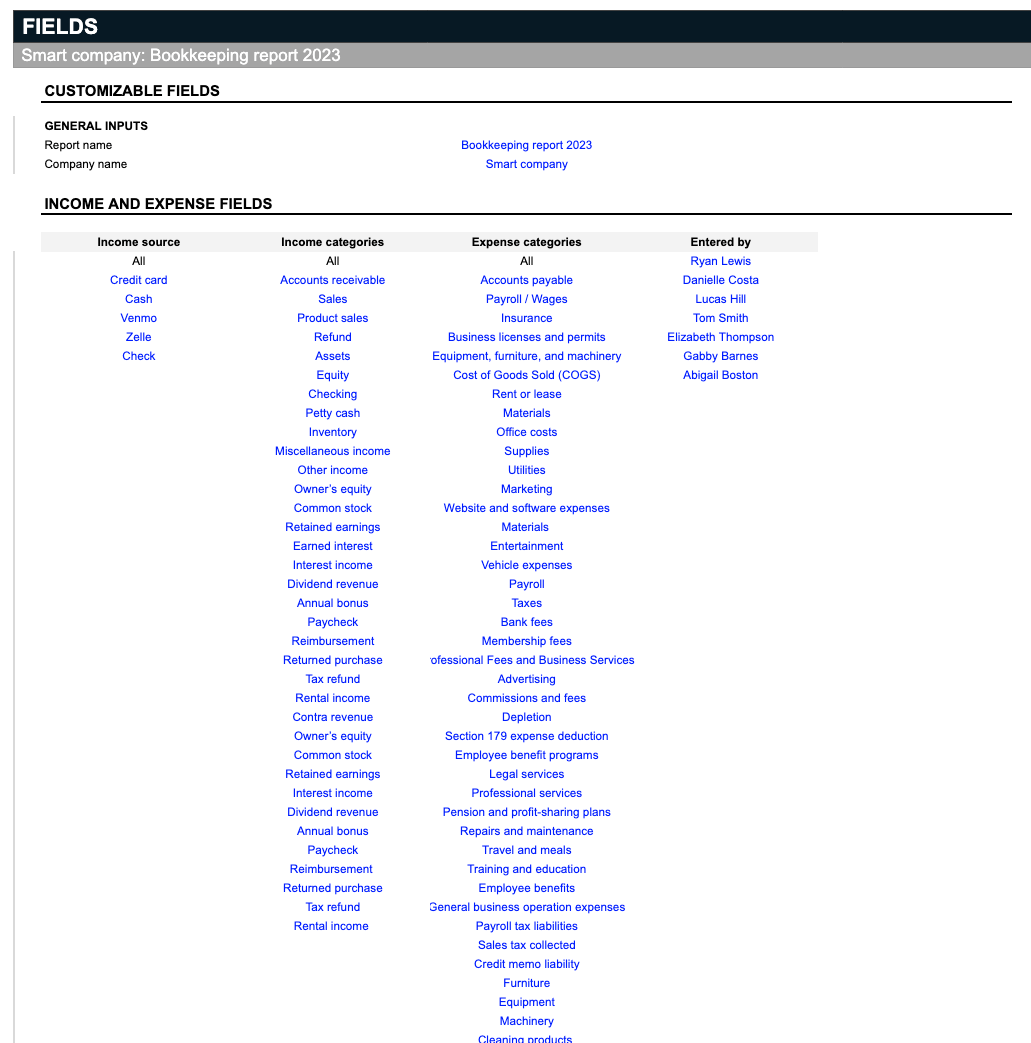
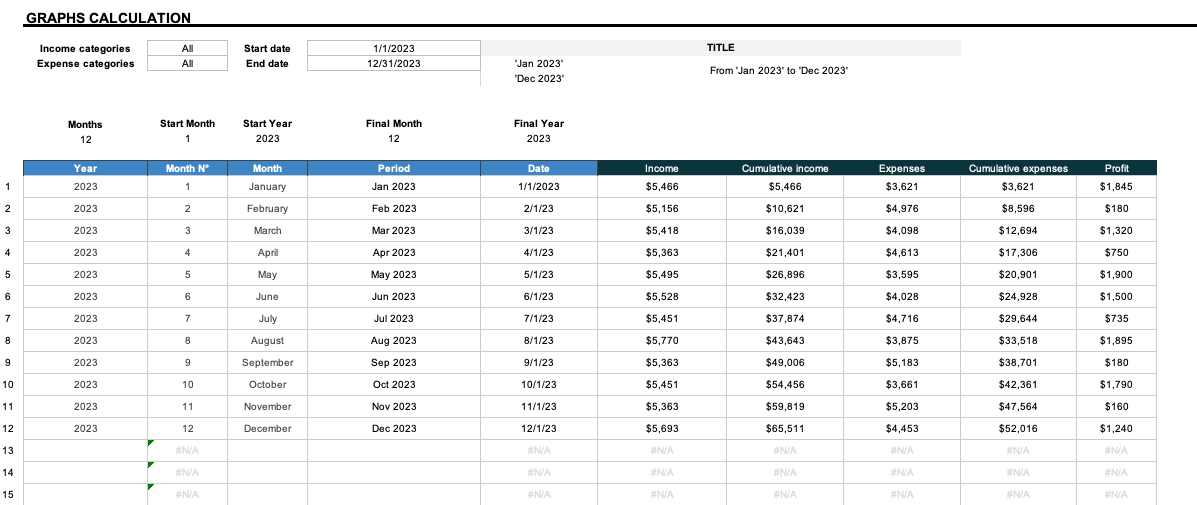
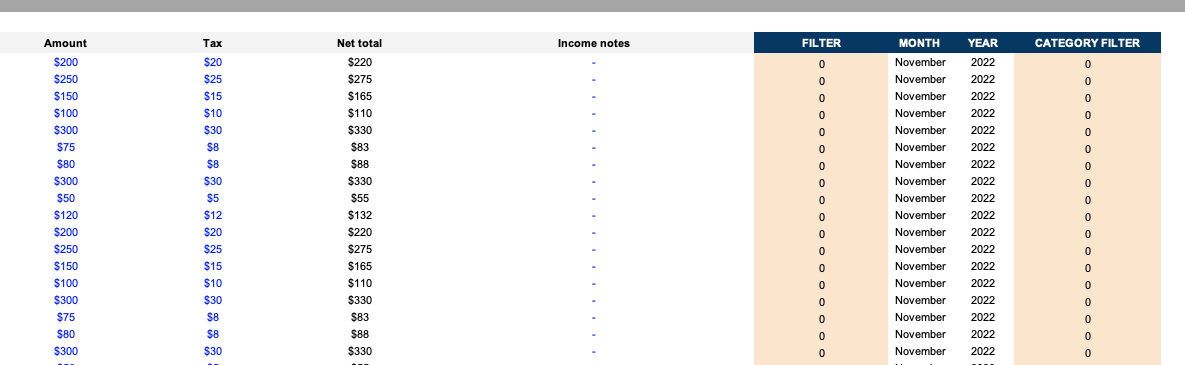
Customizing reports in a bookkeeping dashboard involves several steps to ensure the reports meet your business needs. Start by selecting the data categories you want to include, such as income, expenses, and vendor information. Use the dashboard’s filter options to refine the data based on specific criteria, such as date ranges or expense types. You can also choose from various visualization options, such as bar charts, line graphs, or pie charts, to present the data in the most informative way. Additionally, adjust the layout and format of the report to highlight the most relevant information for your business. Customizable reporting allows you to generate tailored insights that align with your financial goals and decision-making processes.
Question related to this spreadsheet:
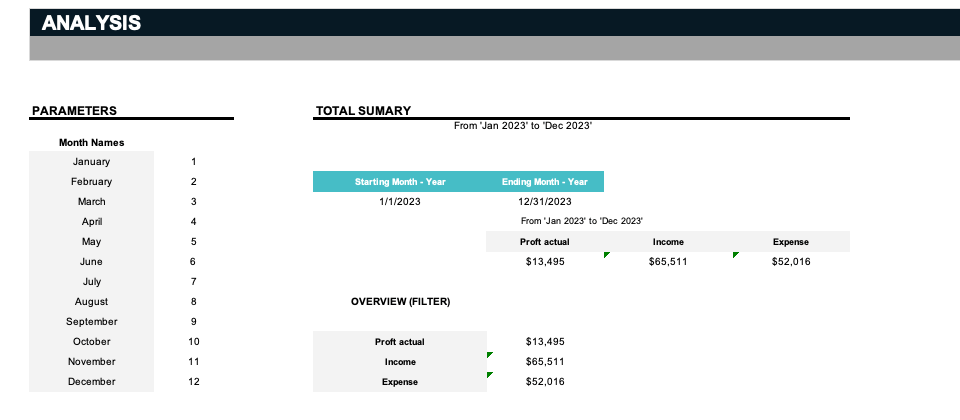
Bookkeeping Dashboard Spreadsheet
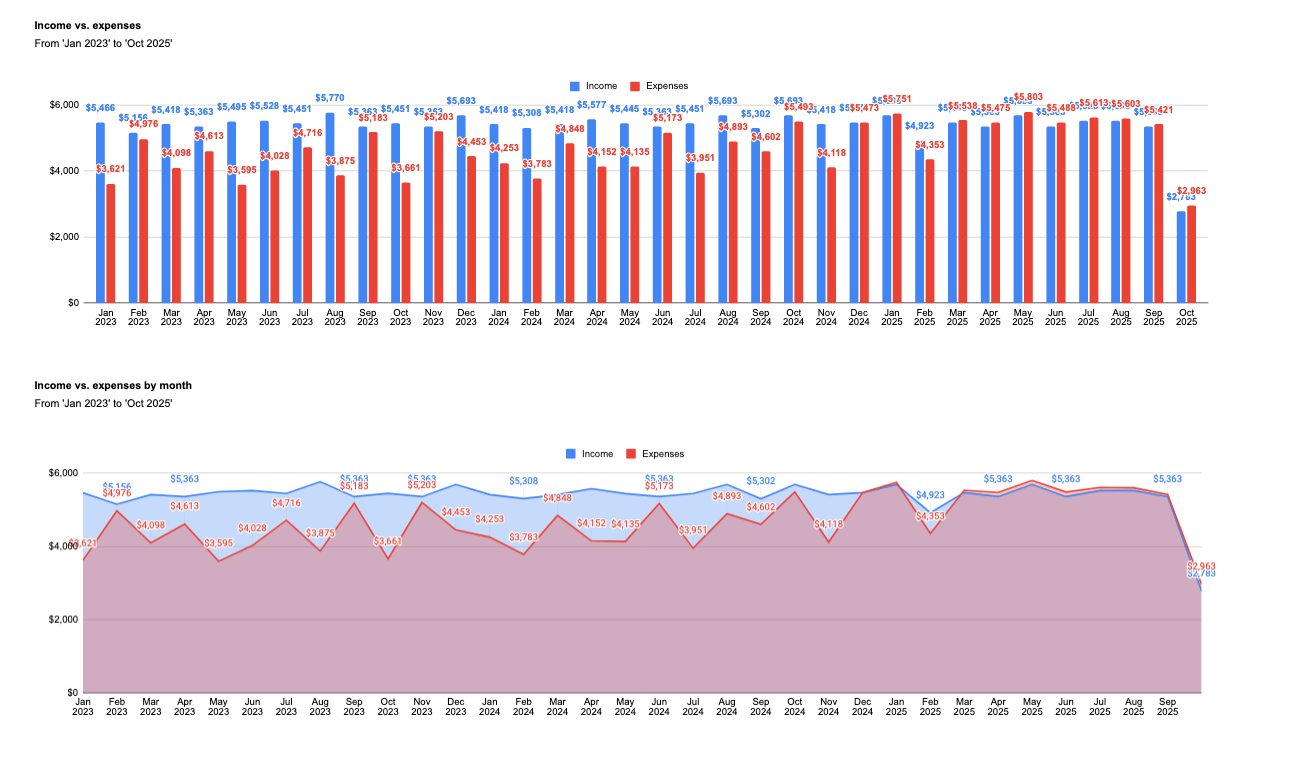
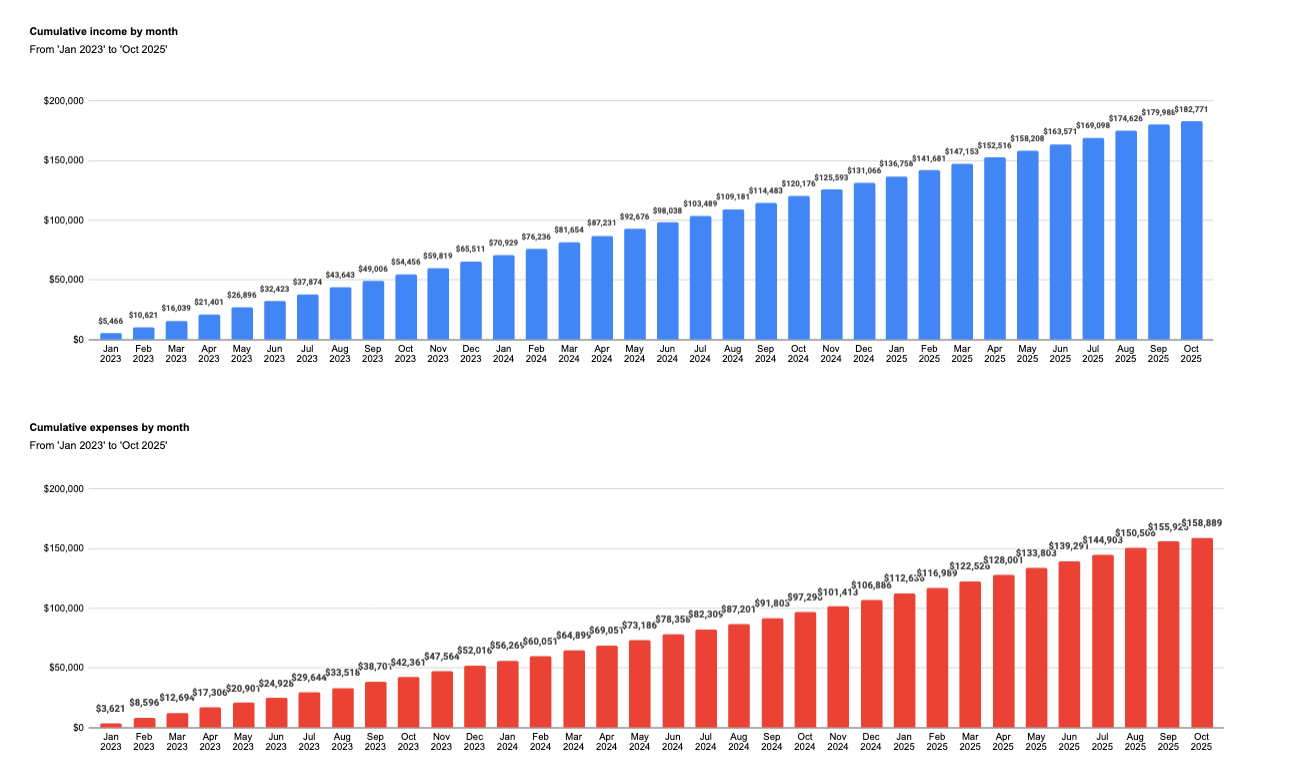
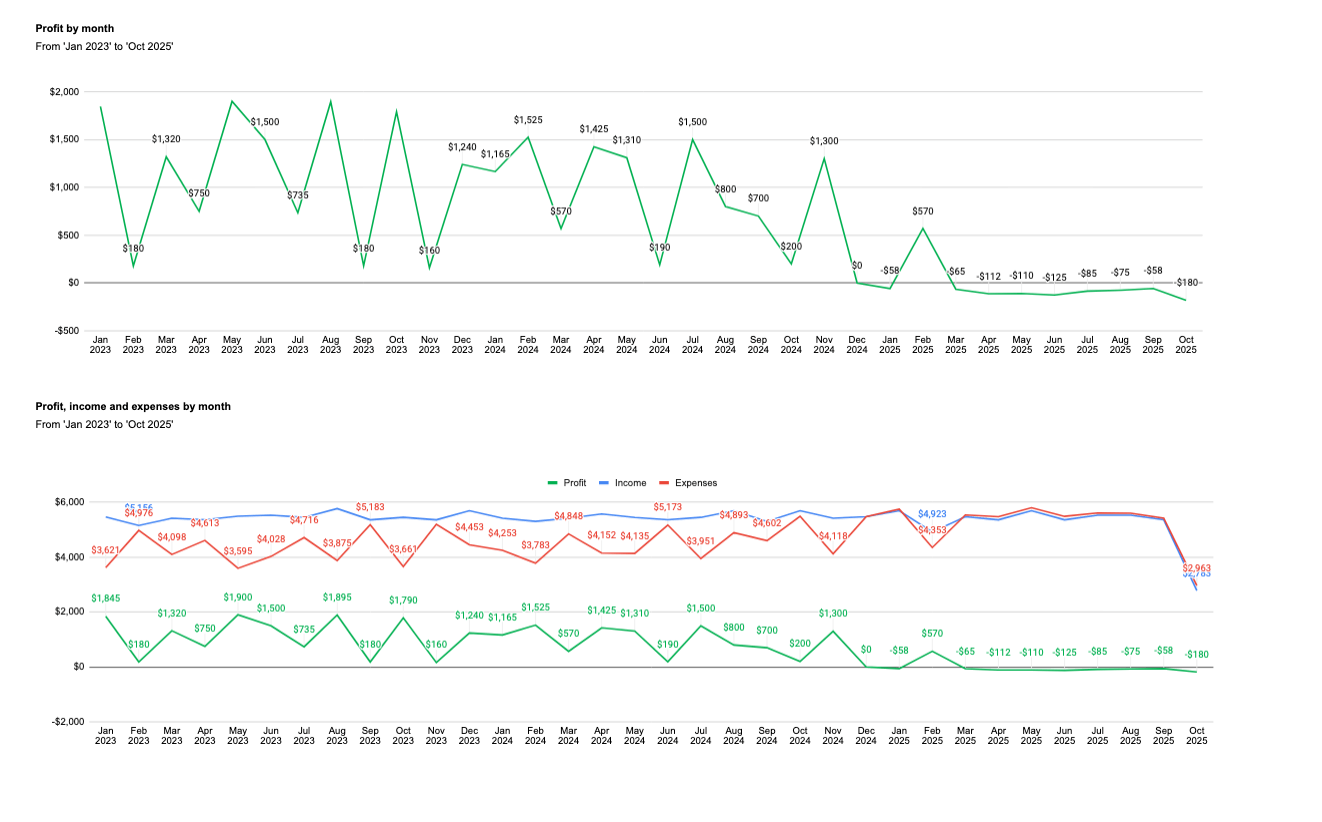
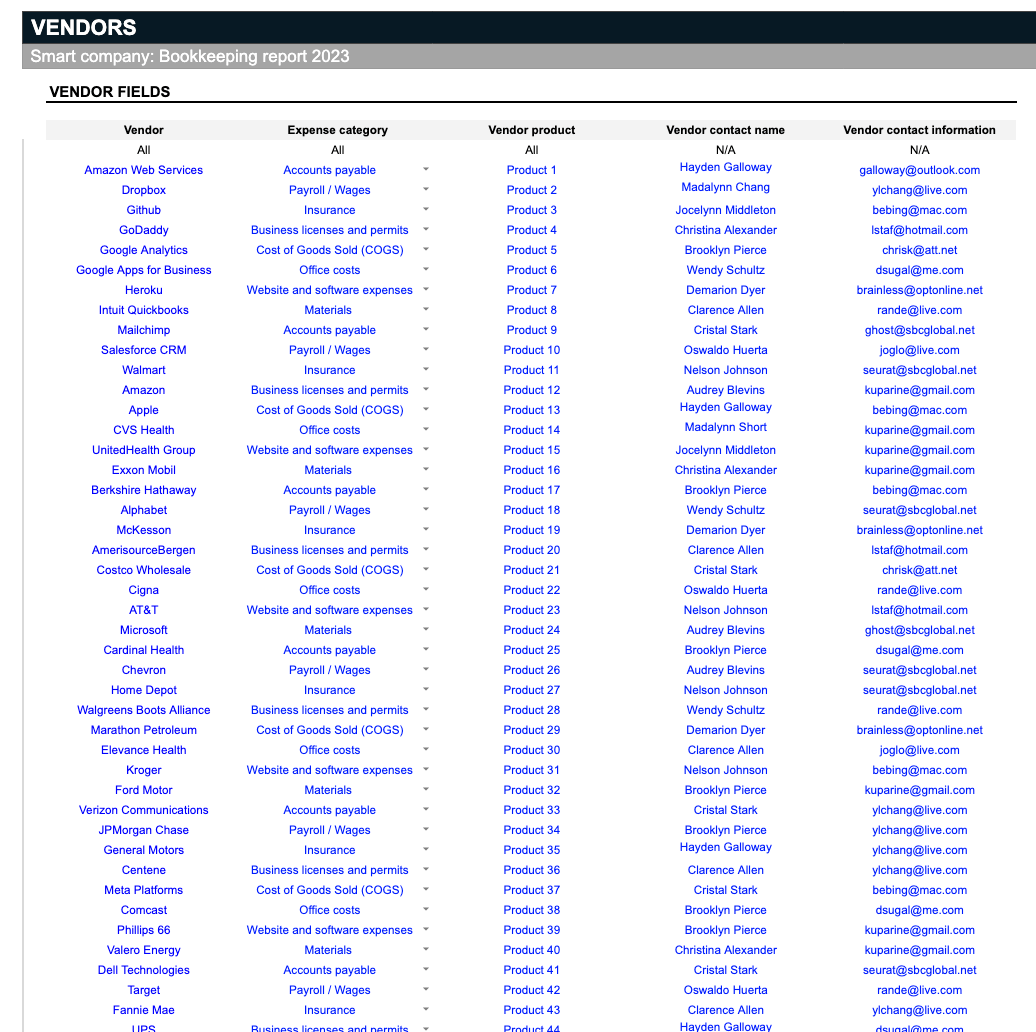
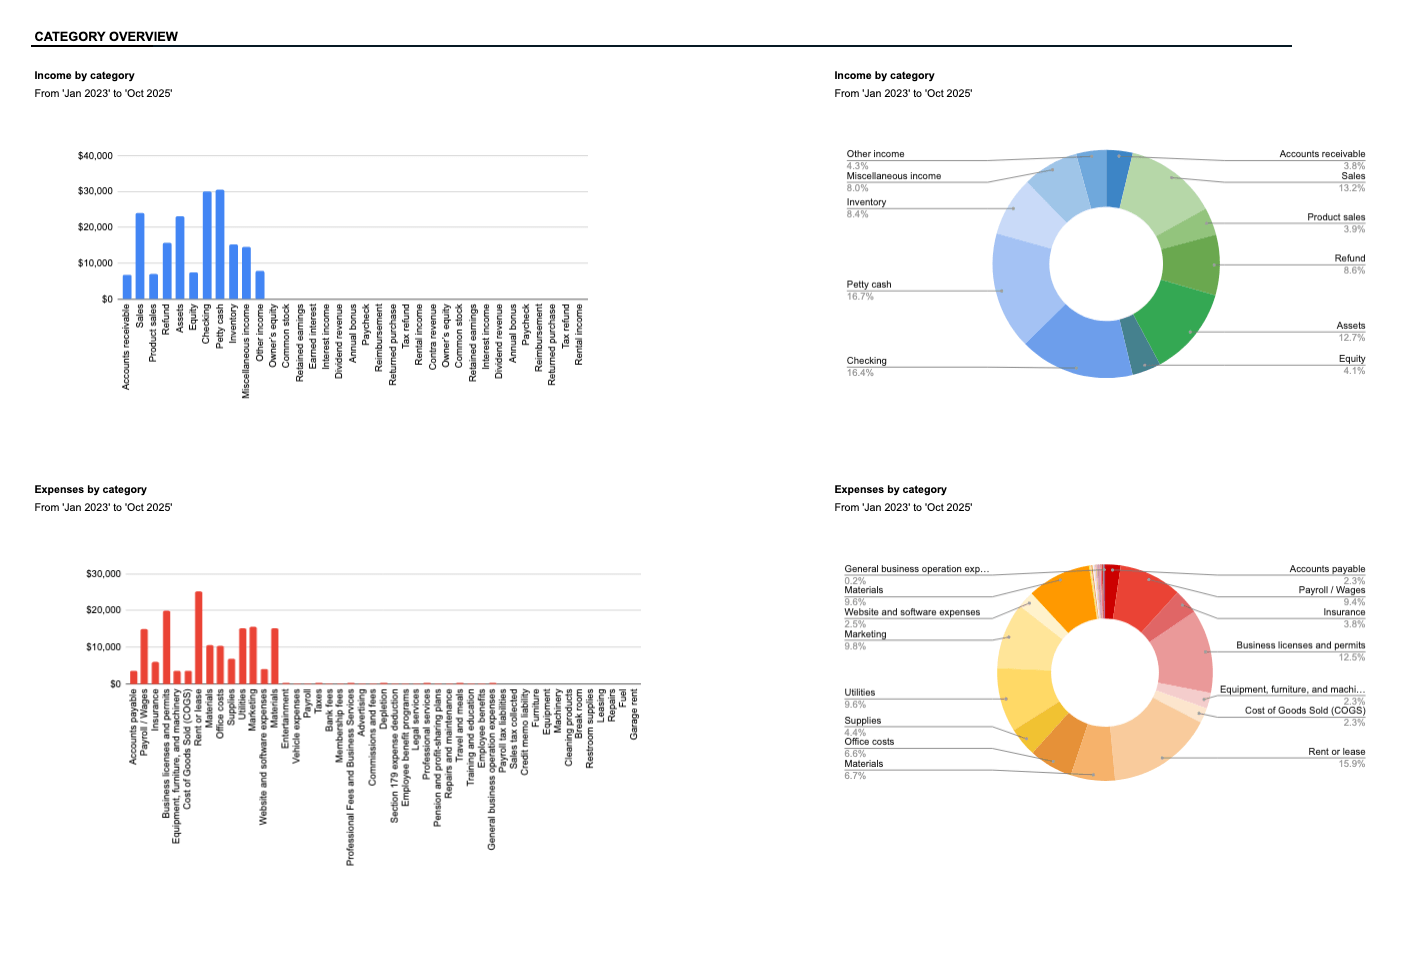
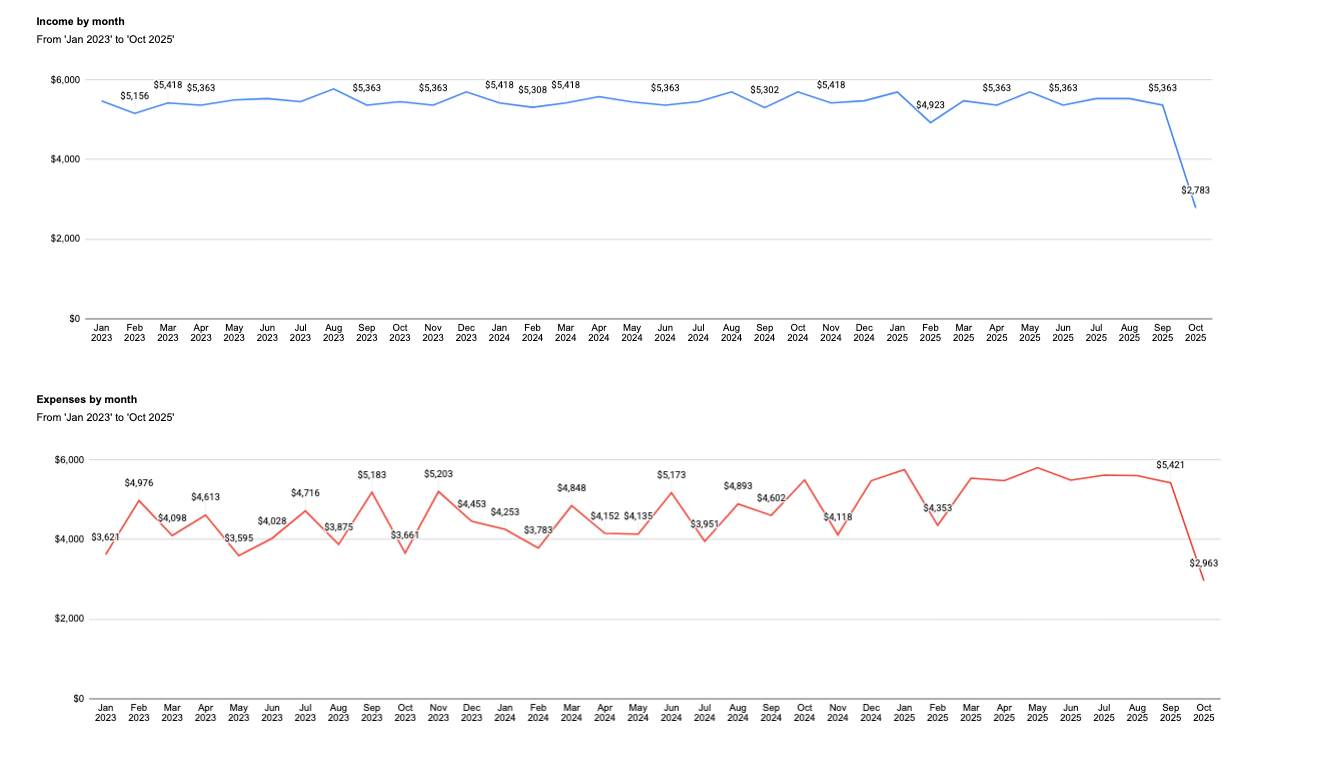
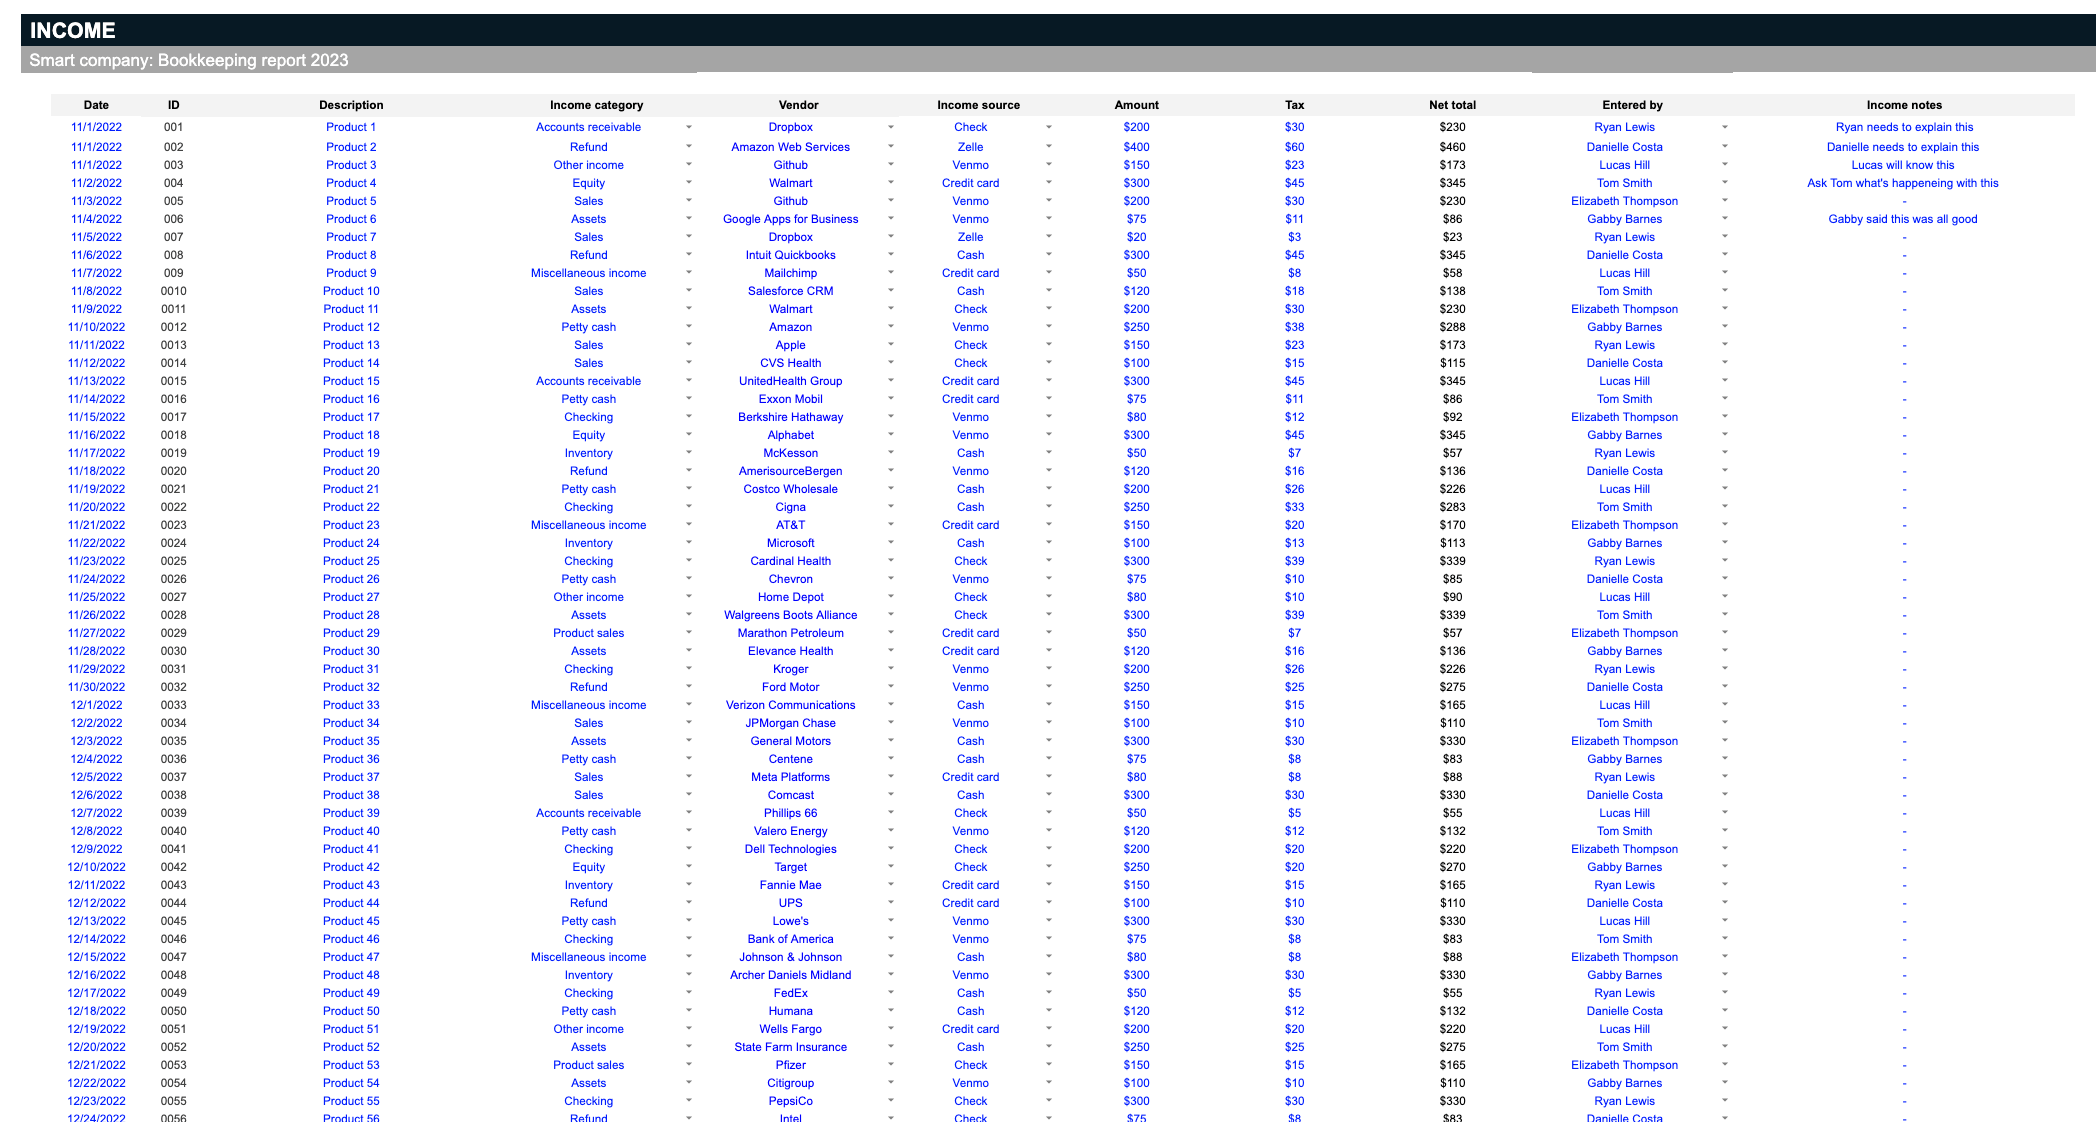
The Bookkeeping Dashboard Spreadsheet is a powerful tool designed to enhance your financial management. With its detailed charts and graphs, customizable fields, and intuitive reporting features, this spreadsheet revolutionizes how you track income, manage expenses, and analyze profit trends. Ideal for both small business owners and seasoned accountants, it provides a streamlined solution to take control of your finances confidently. Discover how the Bookkeeping Dashboard can transform your financial management and open new possibilities for success.
Download this spreadsheet:
Download Excel Format
Copy Google Sheet
Spreadsheet Preview


Download Ultimate Charts Spreadsheet:
Download Excel Format
Copy Google Sheet
Related:
Event Planner Spreadsheet
Employee Scheduler Spreadsheet
Project Plan Spreadsheet
Data Visualization Charts