What is conditional formatting, and how can I use it to highlight important data?
Conditional formatting is a feature in spreadsheets that allows users to automatically format cells based on specific criteria. This feature is useful for highlighting important data, such as values above or below a certain threshold, duplicate entries, or specific text. In Excel, you can find conditional formatting options under the “Home” tab. In Google Sheets, go to “Format” > “Conditional formatting.” You can apply rules such as “Greater than,” “Less than,” “Text contains,” and even custom formulas. Conditional formatting helps in making data visually intuitive and easy to interpret, especially when dealing with large datasets.
Question related to this spreadsheet:
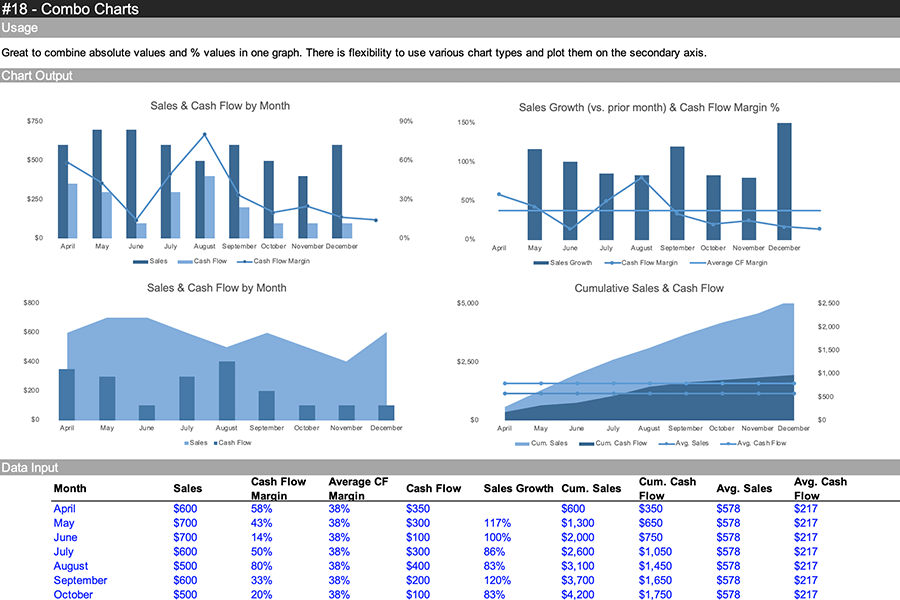
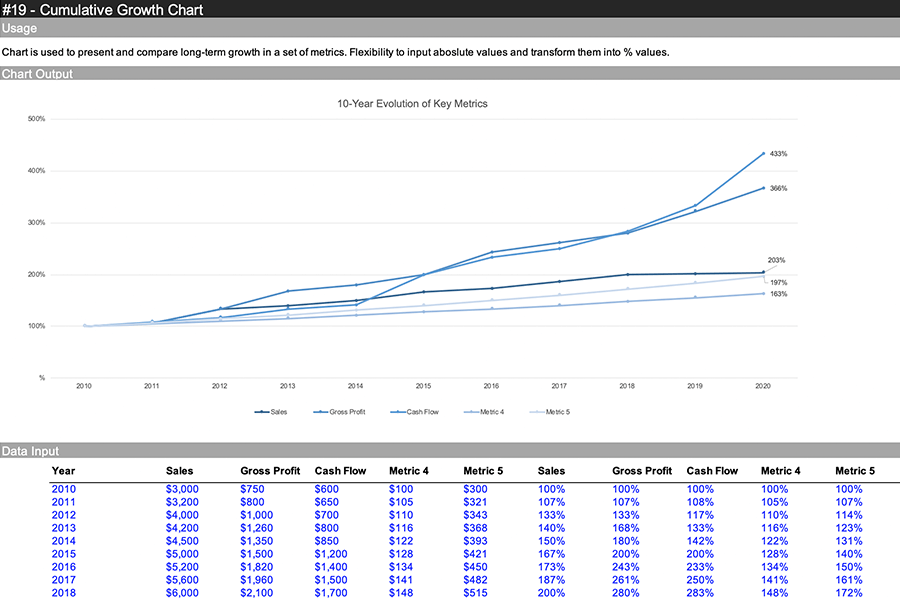
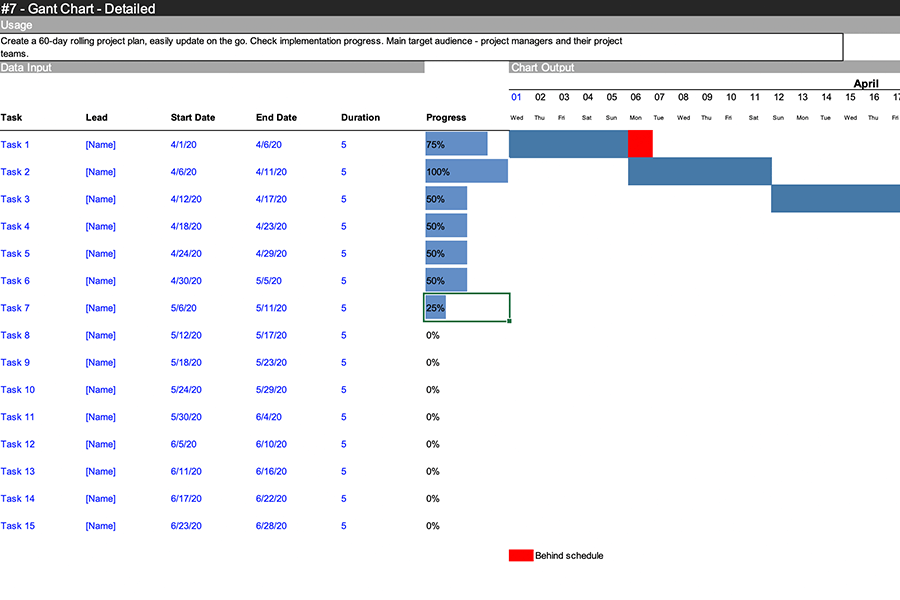
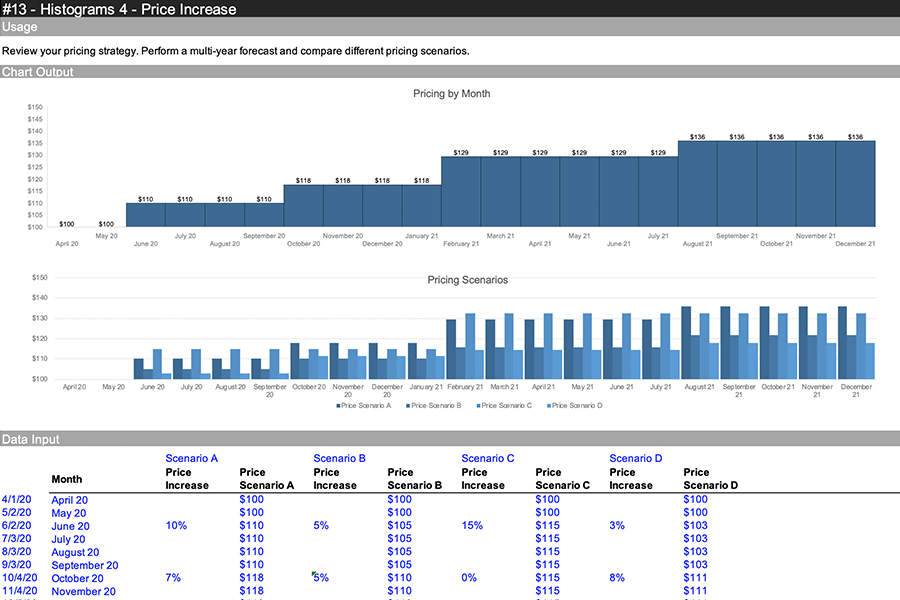
Ultimate Charts Spreadsheet
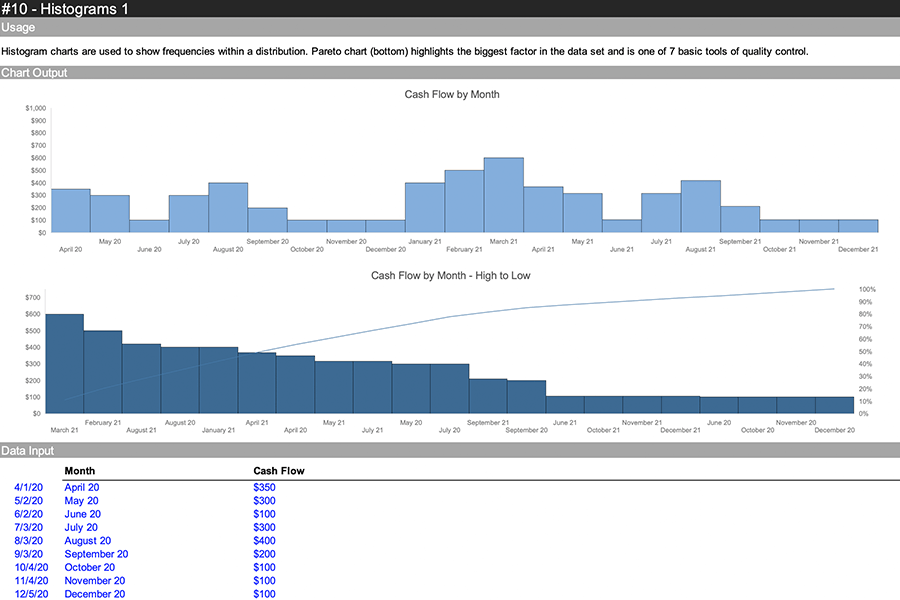
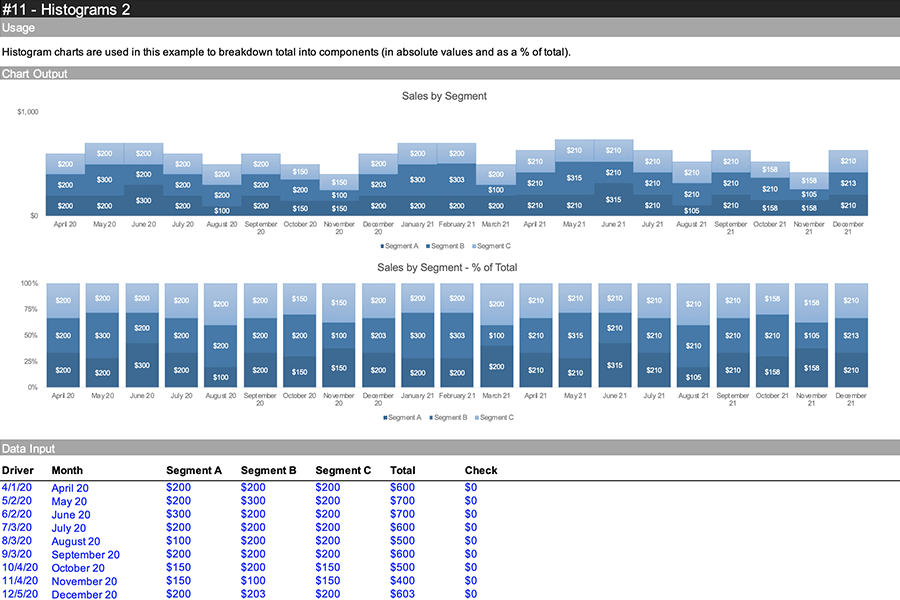
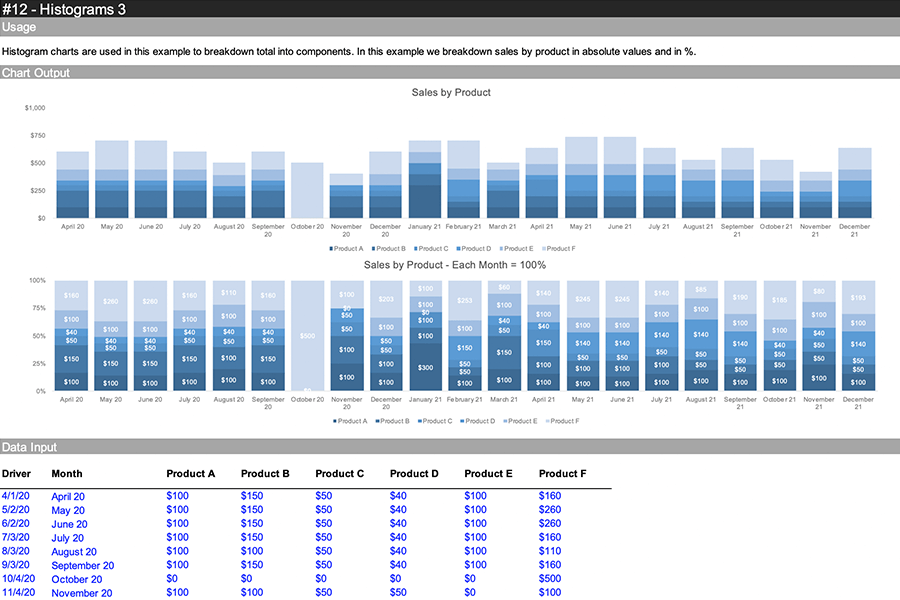
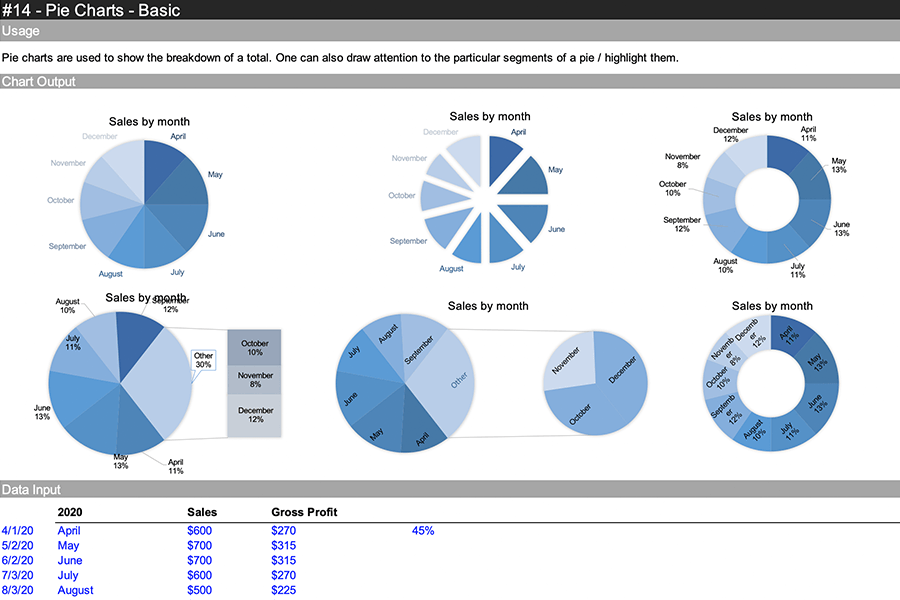
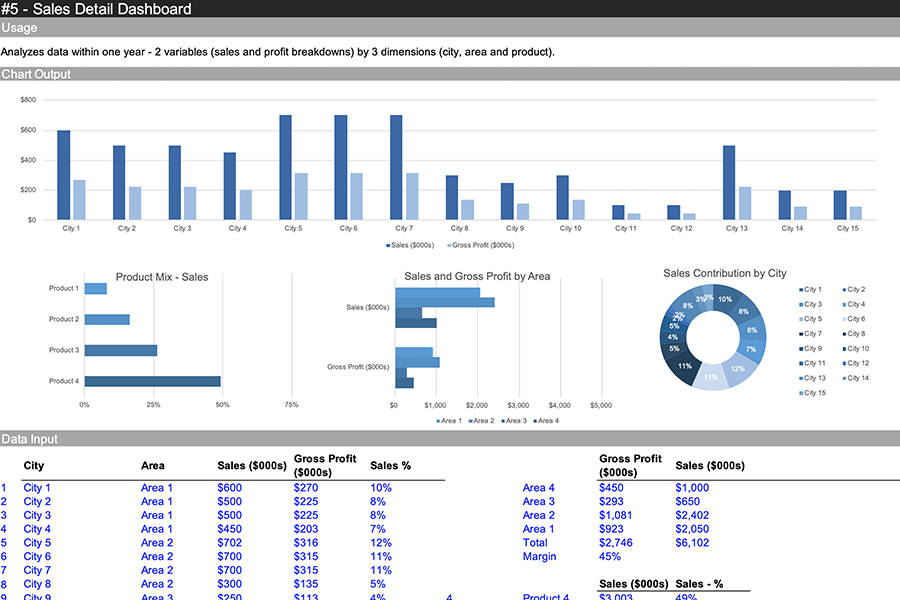
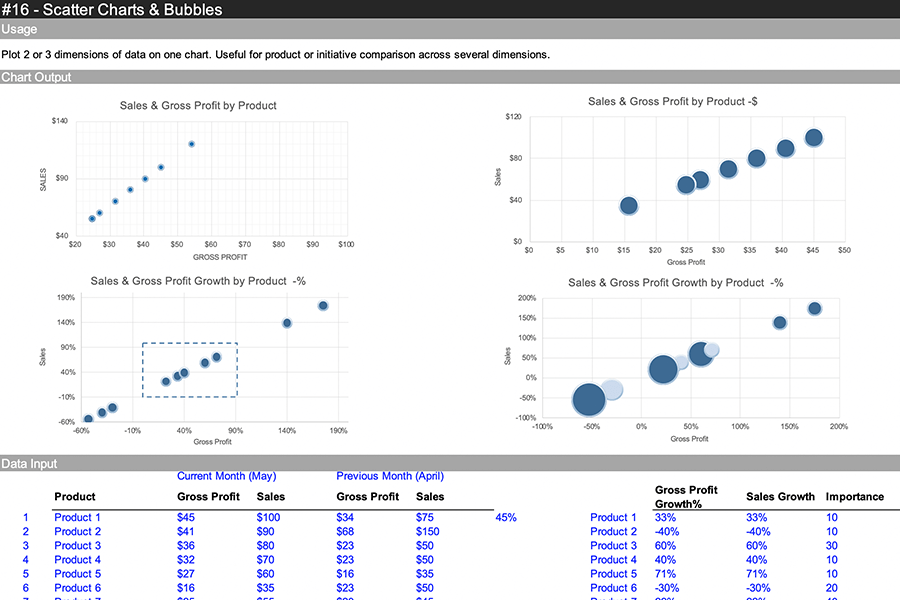
The Ultimate Charts Spreadsheet offers a comprehensive collection of spreadsheet templates designed to simplify the process of creating and utilizing charts in various applications. With two parts comprising different built-in types of charts, including waterfalls, pie charts, stacked areas, histograms, and treemaps, this collection aims to save users time and effort while enhancing their data visualization capabilities. Additionally, chart collages and dashboards are available, providing users with versatile tools for organizing and presenting their data effectively.
Download this spreadsheet:
Download Excel Format
Copy Google Sheet
Spreadsheet Preview


Download Ultimate Charts Spreadsheet:
Download Excel Format
Copy Google Sheet
Related:
Event Planner Spreadsheet
Employee Scheduler Spreadsheet
Project Plan Spreadsheet
Data Visualization Charts